

Best AppDynamics Alternative in 2024
![]() 11 Mins Read
11 Mins Read
AppDynamics empowers organizations to gain deep insights into the performance of their applications and IT infrastructure. With a focus on delivering exceptional user experiences, AppDynamics provides end-to-end visibility across applications, underlying infrastructure, and user interactions.
AppDynamics offers real-time monitoring of applications, providing visibility into various performance metrics such as response times, error rates, and resource consumption. This enables proactive issue identification and resolution.
Transaction Tracing: The platform provides detailed transaction tracing, allowing organizations to trace user interactions across the entire application stack. This feature aids in identifying bottlenecks and optimizing application performance.

Key Features
- Real-Time Monitoring
- Transaction Tracing
- Code-Level Visibility
- Infrastructure Monitoring
- End-User Monitoring
- Business Transaction Monitoring
- AI-Powered Analytics
Limitations and challenges of AppDynamics
- The application flow map is not user-friendly
- Setting up AppDynamics for the first time may pose a challenge for certain users. Enhancements in user experience could be achieved by simplifying the onboarding process or introducing more user-friendly setup wizards, particularly for those new to the platform.
- Not enough documentation
- Recurring costs are very high
- Instrumentations are a heavy lift at times.
- Integrating with various event sources seems challenging.
UptimeMonster
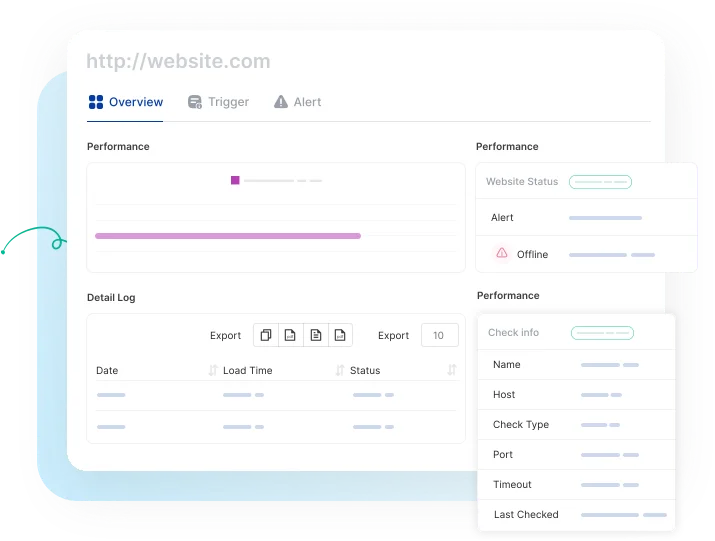
Reliable website and server monitoring service from the cloud to monitor your web availability, performance, and security. The tool will give you a 24/7 website monitoring service that will Monitor the availability of your website, APIs, and business-critical web transactions with powerful synthetic monitoring and testing tools.
It collects, correlates, and monitors servers alongside data from the rest of your stack. UptimeMonster server monitoring allows you to visualize, analyze, and track down different query metrics happening on your server so that you can prevent them before anything goes wrong.
Monitor your network performance like IP, DNS, Service port, Application, and others using the check monitoring tools. It will enable you to understand the network behavior and track NetFlow.
UptimeMonster check monitoring service will give you full control over your network. The check monitoring types are as follows
- TCP (Transmission Control Protocol)
- ICMP PING (Internet Control Message Protocol)
- IP Blacklist
- UDP (User Datagram Protocol)
- DNS (Domain Name Server)
- Application Monitoring
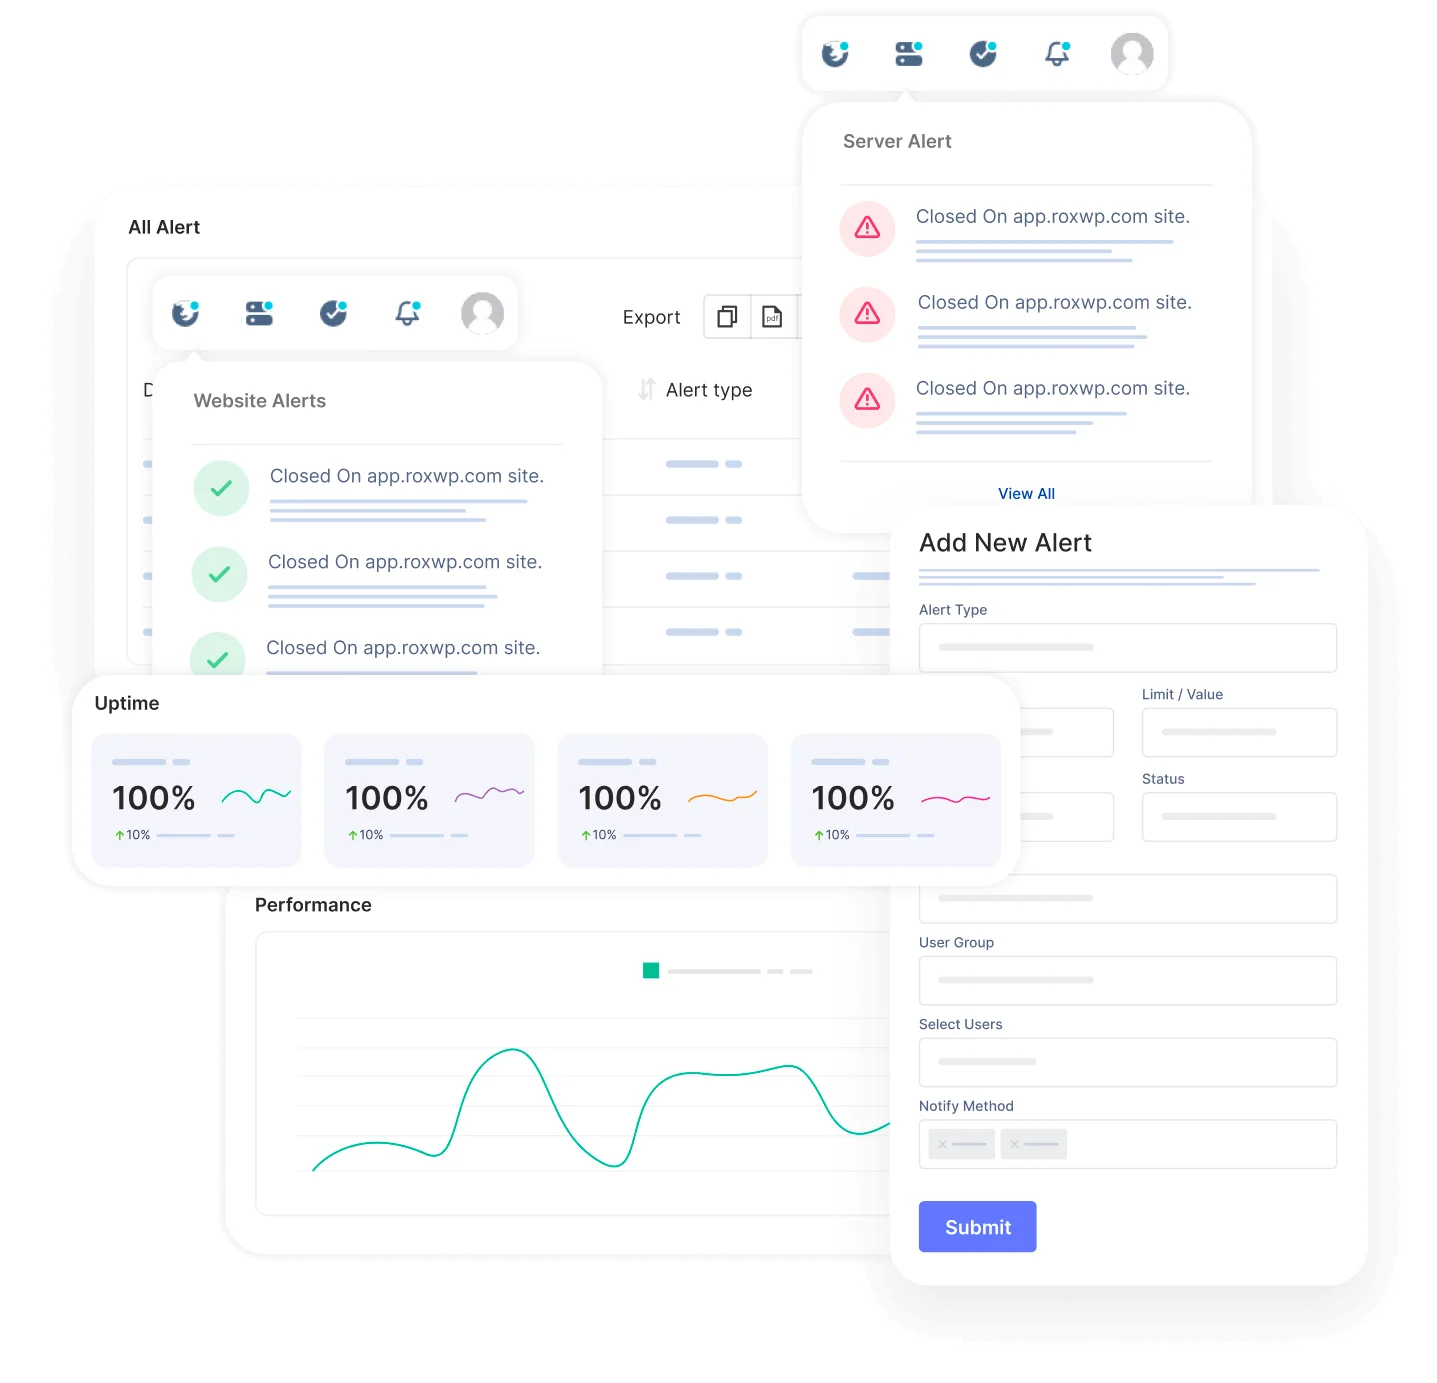
Share your monitoring activities and incidents with customers with a status page. You can easily make our status page public or private. You can highly customize your status page and share it with your customers to reduce the number of customer support tickets.
Using the status page you can easily gain trust from your customers. The alert notification easily notifies your customers about any incidents so that they can take necessary steps to prevent the issue. So that they will always be prepared and stay tuned.
Create and customize intricate policies for the escalation of incidents by taking into consideration various factors, including the passage of time, the availability of your team, and the source or origin of the incident.
The primary advantage, however, lies in integrated incident management and alerting. This is particularly advantageous for DevOps teams aiming to streamline their stack and potentially handle everything from a unified platform, eliminating the necessity for additional platforms.
Key Features
- Reliable Website and Server Monitoring
- Network Performance Monitoring
- Check Monitoring Types
- Status Page Customization
- Alert Notifications
- Incident Escalation Policies
- Incident Timeline
- SSL Expiration Monitoring
- Search String Monitoring
- Monitoring for HTTP(s), Ping, Port, DNS, SSL & TLD expiration, Cron jobs
- Unlimited email and push notification alerts
- Capture screenshots & error logs for incidents
Pros
- Reliable Uptime Monitoring
- Easy Setup and Configuration:
- Cost-Efficiency
- Customer Support:
- Accurate Reporting:
- User-Friendly Interface
- Customizable Alerts
- Status Page
- Escalation policies
- Incident Timeline Report
Cons
According to user reviews, UptimeMonster doesn’t exhibit any notable drawbacks. However, a few users have highlighted certain feature limitations in the free plan offering. These limitations might include restricted access to certain functionalities or reduced capabilities compared to the premium plans. Despite this, the overall consensus from users is overwhelmingly positive regarding the platform’s performance and functionality.
Our perspective on this matter revolves around the notion that smaller teams might not necessitate the utilization of numerous advanced features. Therefore, it appears reasonable to curtail access to certain functionalities, considering that smaller teams might not require or fully utilize these advanced features. This approach ensures a streamlined and more focused user experience, optimizing the platform’s usability for smaller teams with specific needs.
Pricing
- Standard plan at $7/month with 30 monitors and 2-minute interval
- Professional plan at $19/month with 50 monitors and 1-minute interval
- Business plan at $99/month with 100 monitors and 25-second interval
Scout APM
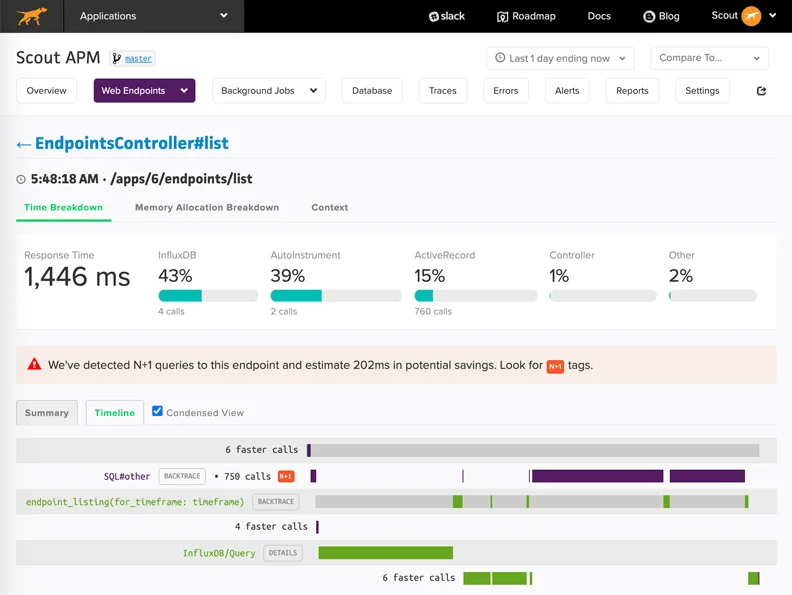
Scout APM is a powerful application performance monitoring (APM) tool designed to help developers identify and resolve performance issues quickly and efficiently. With its intuitive interface and advanced features, Scout APM empowers development teams to optimize their applications for speed and reliability.
Scout APM is a valuable tool for developers prioritizing quick and efficient performance troubleshooting. It’s especially suitable for Ruby, PHP, Python, and Node.js applications and offers cost-effective plans for teams of all sizes.
Key Features
- Easy setup
- Extensive logging
- Identifying N+1 Database Queries
- Affordable
- Better support
Pros
- Developer-centric
- Precise problem identification
- Real-time alerting
- Cost-effective
- Open source
Cons
- Limited language support: Primarily caters to Ruby, PHP, Python, and Node.js applications.
- Data retention limitations: The free tier restricts historical data access.
- Advanced features require higher tiers: Some functionalities (e.g., distributed tracing) are reserved for paid plans.
- Cost: While Scout APM offers valuable features, some users may find the pricing plans relatively higher compared to other APM solutions on the market.
- Limited Integrations: Although Scout APM integrates with popular tools like GitHub and Slack, it may lack integrations with certain niche or specialized tools that some development teams rely on
Pricing
- Basic plan start at $161/month
- Plus plan start at $249/month
- Pro plan start at $499/month
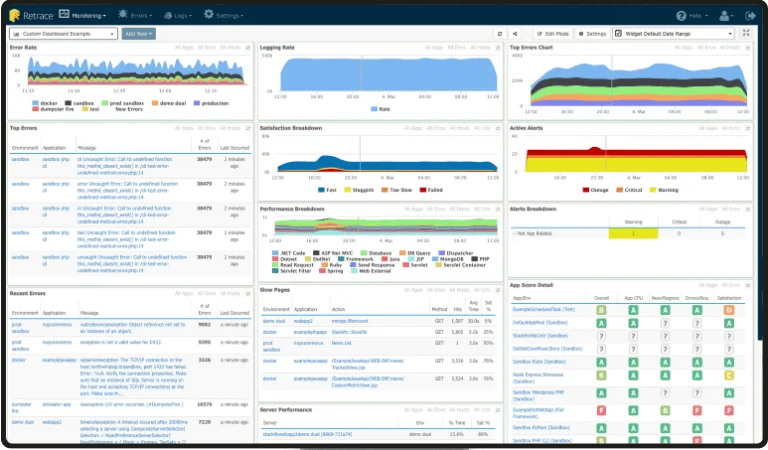
Retrace is a cloud-based application performance monitoring (APM) and logging platform designed for developers and operations teams. It combines code-level tracing, error tracking, log management, and server metrics into a single solution, helping you identify and fix performance bottlenecks quickly and easily.
Retrace boasts detailed logging features that offer an aggregated overview of your application’s statistics. This centralized logging system allows you to conveniently view and search through logs from a single platform, enhancing the depth and quality of your analysis. Furthermore, seamless navigation from individual log statements to complete transaction states ensures a smooth and uninterrupted exploration of your application’s logs.
Key Features
- Powerful Logging
- Improved Application Performance Monitoring
- Lightweight Code Profiling
- Exceptions Visibility
Pros
- Intuitive Dashboard
- Real-Time Alerting
- Application Profiling
- Log Management
- Integration Capabilities
Cons
- Learning Curve: Some users may find the platform initially complex, requiring time to fully grasp its capabilities and configuration options.
- Limited free tier: The free plan has limited features and data storage.
- Can be complex for large-scale deployments and might require additional configuration and expertise for managing complex infrastructure.
- Not ideal for basic website monitoring: Primarily geared towards application performance, not basic website uptime monitoring.
Pricing
- Tier 1 starts at $80/month
- Tier 2 starts at $249/month
Raygun
Raygun is designed to streamline error monitoring and performance management, enabling businesses to identify, diagnose, and resolve issues quickly. With its intuitive interface and powerful features, Raygun empowers teams to deliver high-quality software and maintain optimal performance for their applications.
The Raygun software is revolutionizing the conventional error management process, with a primary focus on simplifying error detection and resolution for software teams. Offering a plethora of features such as error and crash reporting, real user monitoring, application performance monitoring, and enhanced customer experience tools, Raygun caters to the needs of developers and businesses alike, ensuring an optimal user experience for all.
Key Features
- User, Session, and Deployment Tracking
- Powerful Filtering
- Detailed Insights
Pros
- Performance Monitoring
- Error Diagnostics
- Integrations
- Scalability
Cons
- Complexity for Simple Projects: For small-scale or straightforward projects, Raygun’s extensive feature set may be more than what is necessary, potentially leading to unnecessary complexity.
- Limited logging capabilities: This may not be suitable for highly complex logging needs.
- Not ideal for large enterprise needs: Might not scale well for very large and complex applications.
Pricing
- Basic plan at $40 Per 100,000 errors/mo
- Team plan at $80 Per 200,000 errors/mo
- Business plan at $40 Per 1,000,000 errors/mo
Sumo Logic
Sumo Logic is a cloud-native platform that offers comprehensive log management and observability solutions. It empowers organizations to centralize, analyze, and visualize data from diverse sources, including applications, infrastructure, and security systems, providing valuable insights for informed decision-making.
Its unified platform, real-time capabilities, and advanced analytics make it an attractive choice for organizations seeking to gain deeper insights from their data and optimize their operations. However, carefully consider the potential cost, learning curve, and resource requirements before choosing Sumo Logic to ensure it aligns with your budget and technical expertise.
Key Features
- Log management
- Infrastructure Monitoring
- Application Observability
- AWS Monitoring
- Kubernetes Monitoring
- Threat detection
- PCI compliance
- Security data lake
Pros
- Provides a single source of truth for all your log data, simplifying management and analysis.
- Gain instant visibility into your systems, enabling proactive problem resolution.
- Uncover hidden insights and trends with powerful search and analysis capabilities.
- Delivers robust security features for threat detection and incident response.
- Adapts to your needs and accommodates data growth.
- Offers a limited free plan for basic log management.
Cons
- Paid plans can be expensive for larger organizations with high data volumes.
- Setting up and configuring advanced features might require some technical expertise.
- The mobile app offers a less comprehensive experience compared to the web interface
Pricing
Sumo Logic offers a free tier with limited features and a pay-as-you-go model with various pricing plans based on data ingestion volume and desired features.
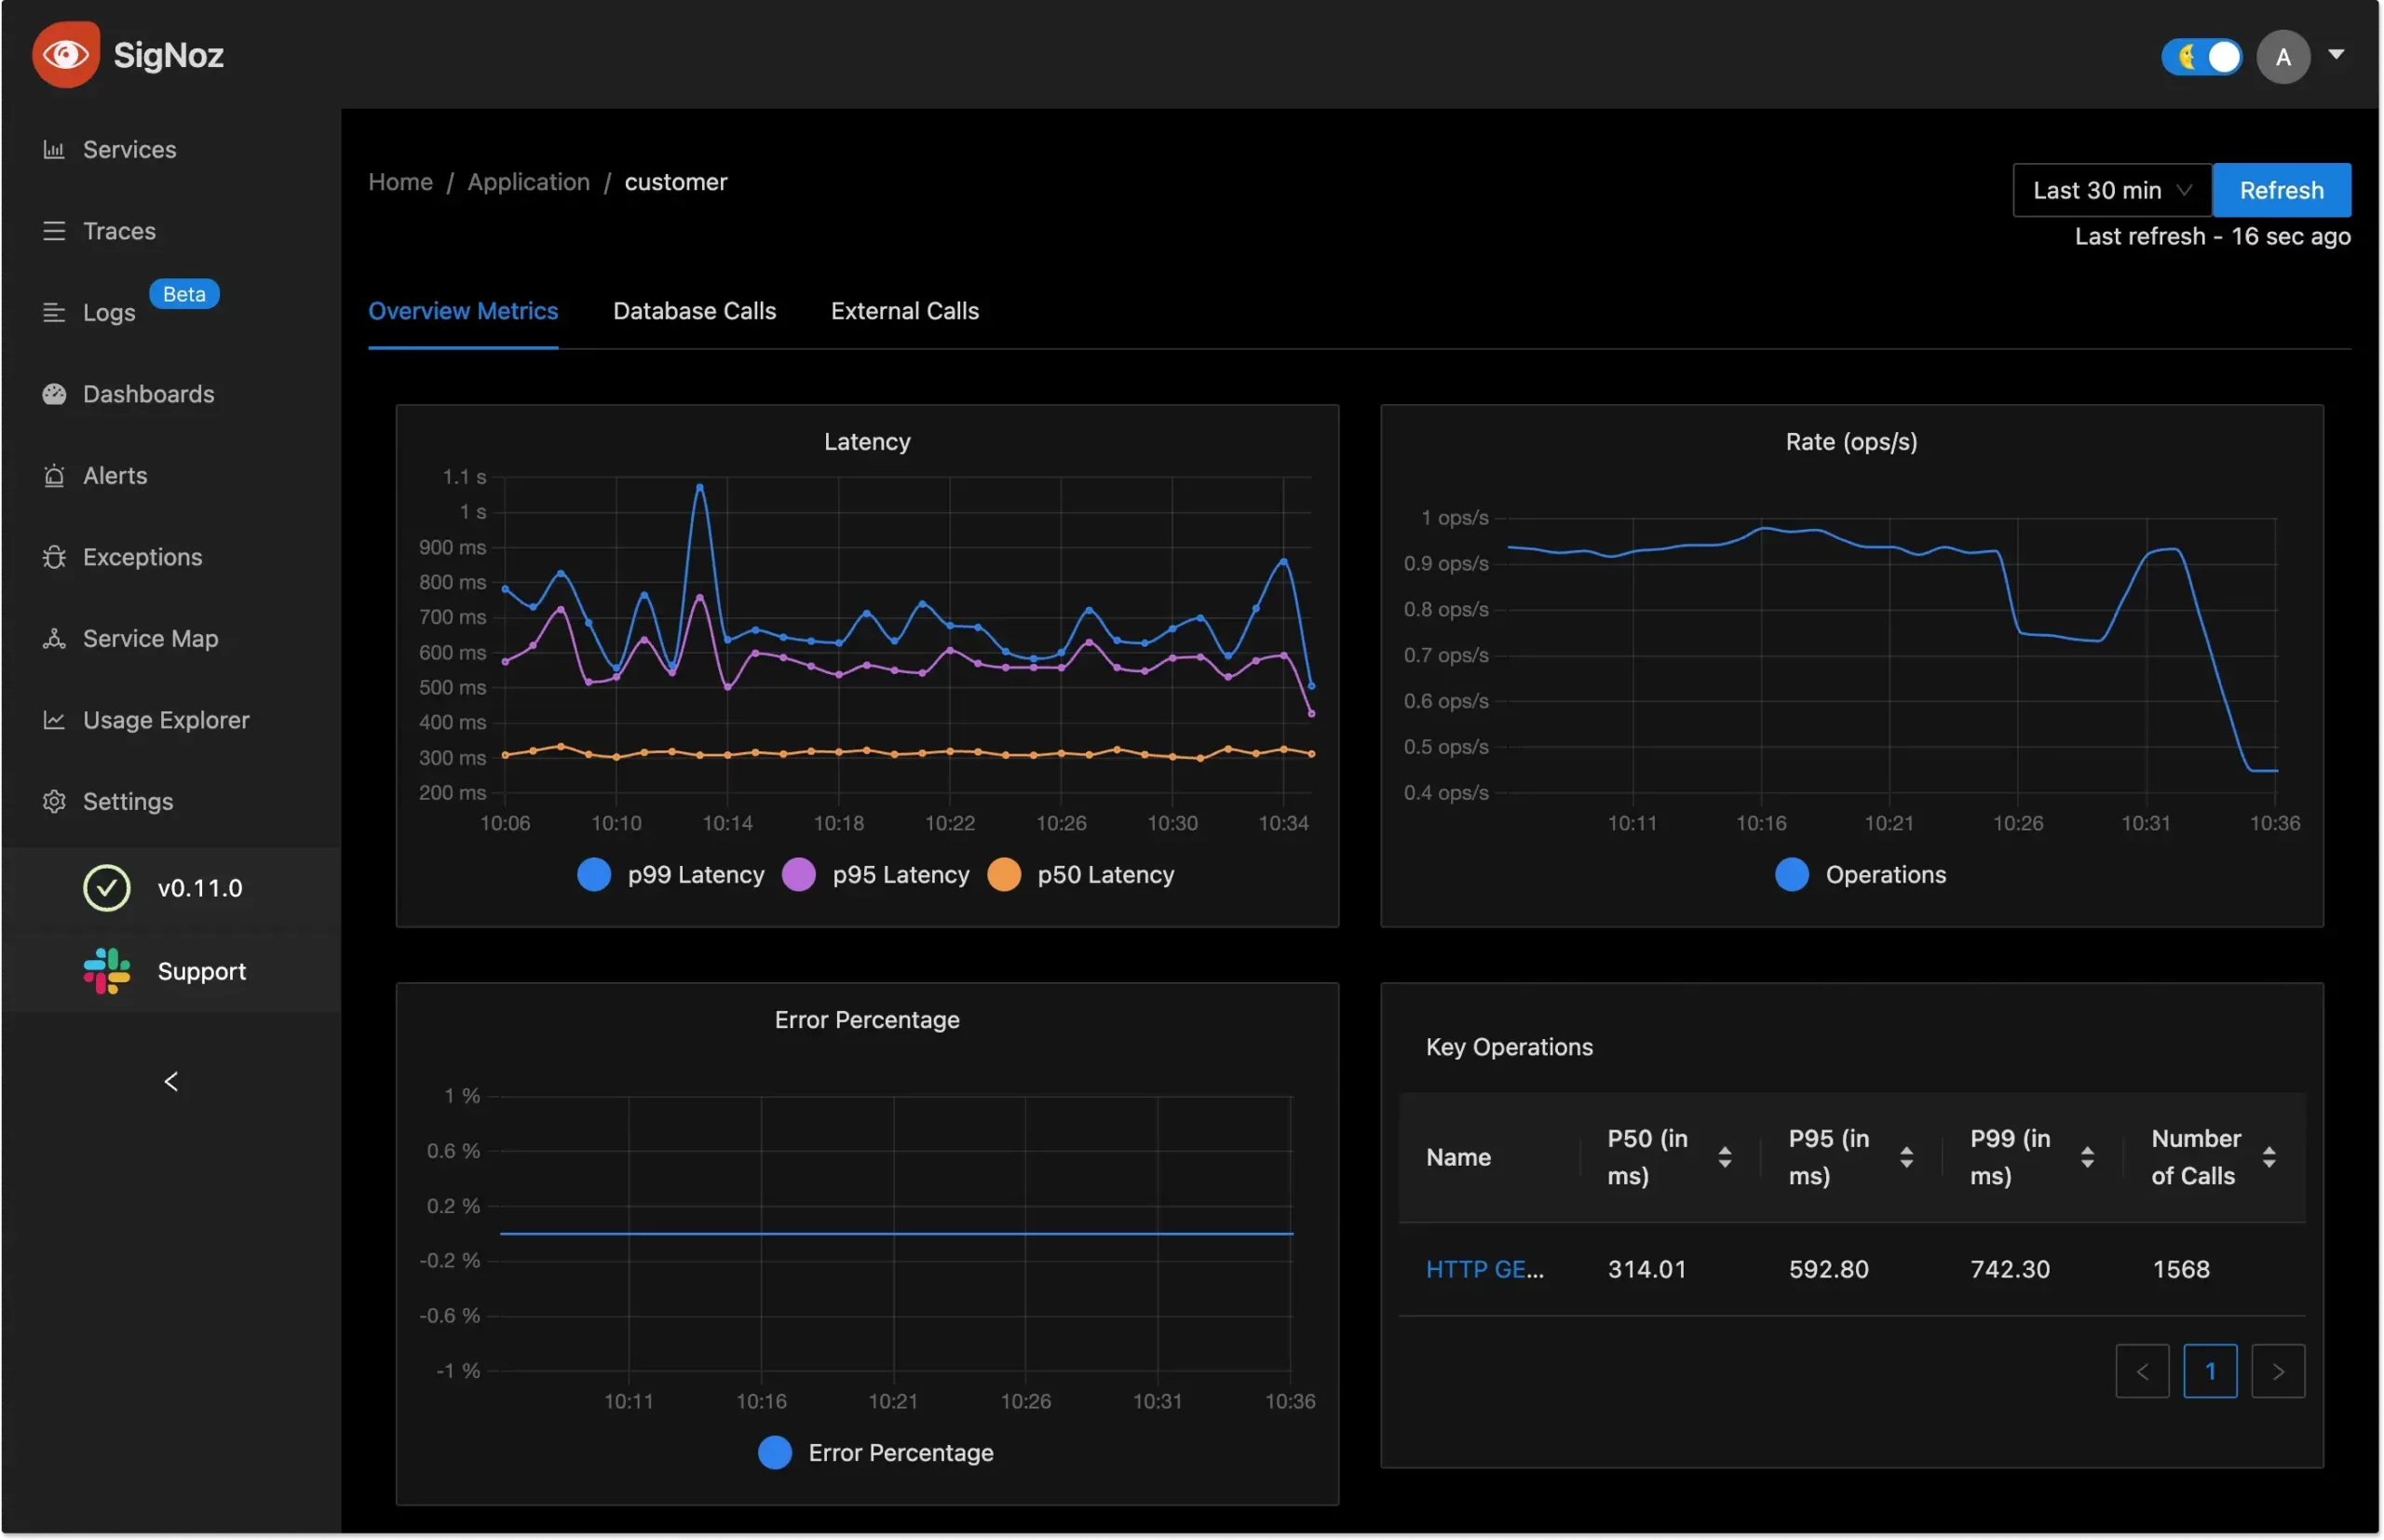
SigNoz
Signoz.io is a cutting-edge observability platform designed to provide comprehensive monitoring and troubleshooting capabilities for modern cloud-native applications. The platform offers a suite of features including log aggregation, metric collection, tracking, and alerting capabilities. It consolidates metrics, traces, and logs within an integrated user interface, facilitating seamless visualization and rapid issue resolution.
With native support for OpenTelemetry, it efficiently generates and manages telemetry data, enhancing observability across the system. Developed with a focus on developers, it leverages cutting-edge technologies like Go, Typescript, and React.js to ensure a modern and user-friendly experience.
Key Features
- Distributed Tracing
- Metrics Monitoring
- Alerting and Notification
- Root Cause Analysis
- Integration with DevOps Tools
- Scalability and Flexibility
Pros
- Signoz.io provides comprehensive observability capabilities, including distributed tracing, metrics monitoring, and alerting, enabling users to gain deep insights into their application’s performance and behavior.
- The platform offers a user-friendly interface and intuitive navigation, making it easy for users to set up monitoring and troubleshoot issues without extensive training or expertise.
- Signoz.io allows users to customize dashboards, alerts, and monitoring configurations to suit their specific requirements, providing a tailored observability experience.
- Signoz.io is built on open-source technologies, making it accessible to a wide range of users and enabling contributions from the community to enhance its capabilities and features.
Cons
- The free plan has restricted features and data storage.
- Mastering advanced features might require some technical expertise.
- Not as established as some larger observability platforms, leading to a smaller community of support
- Integrating Signoz.io with existing infrastructure and applications may require some effort, especially in complex, distributed environments with diverse technology stacks.
Pricing
SigNoz.io offers a free plan for basic monitoring and paid plans with various features and data storage limits.
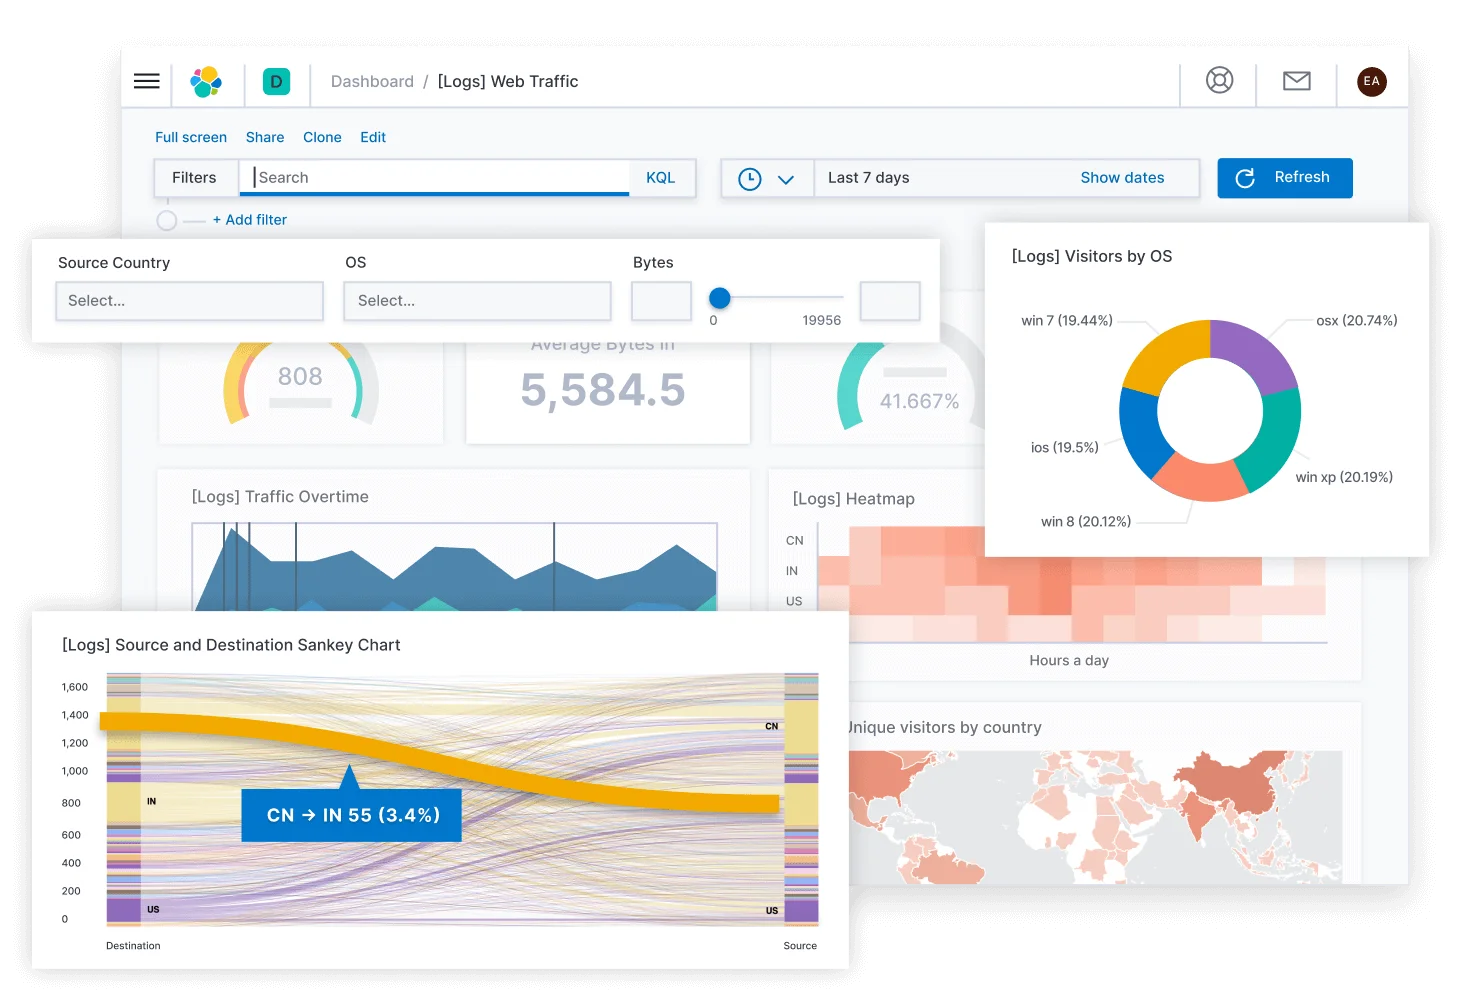
Elastic Stack
Elastic Stack, formerly known as ELK Stack, is a powerful collection of open-source tools designed for searching, analyzing, and visualizing large volumes of data in real time. Comprised of several components, each with its unique functionality, Elastic Stack provides a comprehensive solution for various data management and analysis tasks.
At the core of Elastic Stack is Elasticsearch, a distributed search and analytics engine. It stores and indexes data in near real-time, enabling fast and efficient searching across massive datasets. Elasticsearch is highly scalable, fault-tolerant, and supports complex querying capabilities.
Logstash is a versatile data processing pipeline that ingests, transforms, and enriches data from multiple sources before indexing it into Elasticsearch. It supports a wide range of input sources, including logs, metrics, and event streams, and offers extensive filtering and parsing capabilities.
Key Features
- Open-source and cost-effective: The core functionality is free to use, making it budget-friendly for various needs.
- Scalable and flexible: Adapts to accommodate growing data volumes and diverse use cases.
- Real-time insights: Gain instant visibility into your data, enabling proactive decision-making.
- Powerful search and analysis: Explore and analyze data with precision using Elasticsearch’s robust capabilities.
- Stunning visualizations: Kibana empowers you to create impactful dashboards and reports for clear communication.
- Active community and support: Benefit from a vibrant community offering resources and assistance.
Pros
- Scalability
- Real-Time Data Processing
- Versatility
- Open-Source
- Comprehensive Toolset
Cons
- Complexity
- Resource Intensive
- Learning Curve
- Maintenance Overhead
- Documentation Gaps
- Licensing Considerations
Pricing
- Standard package starts at $95/month
- Gold package starts at $109/month
- Platinum package starts at $125/month
- Enterprise package starts at $175/month
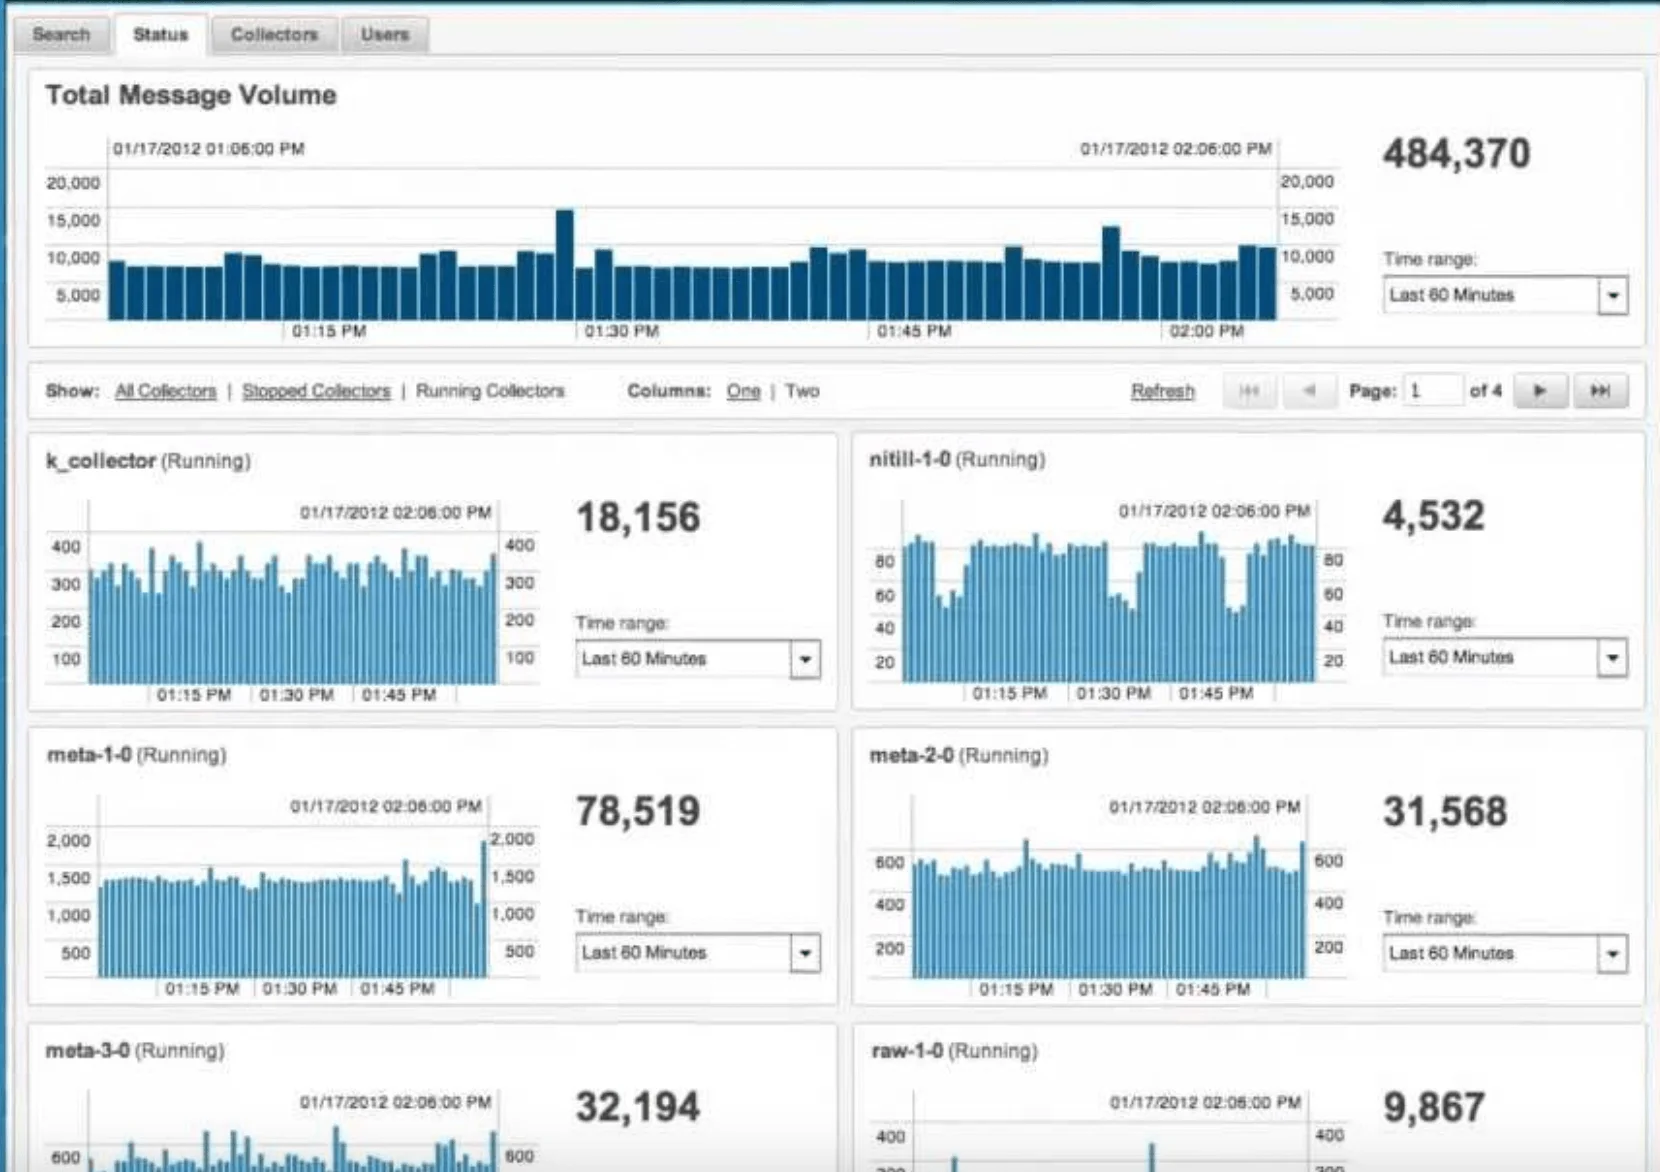
Splunk
It is a powerful and versatile data analytics platform designed to turn machine-generated data into valuable insights. Splunk can ingest and index data from a wide variety of sources, including logs, events, and metrics, providing a centralized platform for managing diverse datasets.
It integrates seamlessly with a wide range of third-party applications, services, and technologies. This allows users to pull in data from various sources and create a unified view for comprehensive analysis. It also has a vibrant user community and an extensive ecosystem of apps and add-ons. This community-driven approach contributes to the platform’s richness and adaptability to diverse use cases.

Key Features
- Synthetic Monitoring
- Log Aggregation
- Application Monitoring
- Infrastructure Monitoring
- Automated Anomaly Detection
Pros
- Data Selection and Processing
- Ingestion Techniques
- Role-based access to specific logs
- Log event searching
- Exporting is easy
- Extensive data integration capabilities, accommodating diverse formats
- Performing effectively with unstructured data from a variety of sources.
Cons
- Expensive as compared to its competitors
- Don’t have the capability to edit the config files directly
- Deploying apps requires a support ticket and can have a long turnaround time
- Outdated user interface design
- Limited capabilities in data modeling and machine learning
Pricing
Splunk offers adaptable pricing plans designed to cater to the unique requirements of businesses. Costs start at $15 per host/month, with variations depending on the license type and data usage. For example, a 500 MB license is available starting at $5,000.
Zenoss
Zenoss is a unified monitoring platform that helps businesses of all sizes gain visibility and control over their IT infrastructure. It goes beyond simple monitoring, offering intelligent event correlation, automation, and remediation capabilities to keep your systems running smoothly.
Its remarkable scalability and holistic monitoring approach distinguish it from the rest. In my evaluation, Zenoss stands out as the “Top Choice for unified monitoring in large-scale environments,” thanks to its broad infrastructure coverage and the depth of its monitoring capabilities.
Key Features
- Real-Time Analytics
- Capacity Planning
- Root Cause Analysis
- Extensive Integrations
- Cloud Integration
- Private Cloud and Virtualization Support
Pros
- Extensive Range of Integrations
- Comprehensive Monitoring Features
- Scalable for Large-Scale Environment
- Increased visibility and control
Cons
- No Transparent Pricing Available
- Complex Setup and Configuration
- Perceived Complexity Compared to Similar Tools
Pricing
- Starter Edition: Up to 250 devices – $5,000 per year
- Standard Edition: Up to 1,000 devices – $10,000 per year
- Enterprise Edition: Unlimited devices – Contact Zenoss for a quote
Wrapping Up
Choosing the best AppDynamic alternatives requires a thorough assessment of your unique requirements and how well they match the features provided by different monitoring solutions.
After conducting thorough research and rigorous testing, UptimeMonster has proven itself as the premier substitute for Splunk. It encompasses all the vital features essential for smooth project management, presenting a cost-effective solution that is especially advantageous for startups and small teams.