Best Site 24×7 Alternative in 2024
Site24x7 provides a comprehensive Monitoring Solution, encompassing the surveillance of Websites, Servers, Cloud infrastructure, Networks, Applications, and Real Users.
With Site24x7, you gain the ability to oversee the performance of various internet services including HTTPS, DNS servers, FTP servers, SSL/TLS, POP, URLs, REST APIs, and SOAP Web services, from over 110+ locations worldwide. Additionally, it offers monitoring capabilities for various platforms such as Windows, Linux, FreeBSD, VMware, Nutanix, Docker, and Kubernetes.
The platform offers Synthetic web transactions, application performance monitoring, and Real User Monitoring functionalities. Furthermore, Site24x7 provides features for managing cloud costs, creating public status pages, handling Logs from the cloud, and more.
Limitations and challenges of site 24*7
- Complex User Interface: Many users have voiced concerns about the platform’s complex interface, noting a steep learning curve that hinders new users from fully utilizing its capabilities.
- Lack of Features: Some users have encountered limitations with Site24x7, particularly in terms of missing features essential to their monitoring needs or integrations with other tools they utilize.
- Unreliable Performance: Reports of inconsistent performance, including false alarms or missed alerts, have been noted by some users, potentially causing unnecessary alarms or failing to detect critical issues.
Factors to Consider When Exploring Site24x7 Alternatives:
- Features: Prioritize assessing whether alternative solutions offer the necessary features, including specific monitoring types, alerting functionalities, and integrations with other tools, aligning closely with your requirements.
- Ease of Implementation: Evaluate the ease of implementing and navigating alternative tools. While some may offer robust features, they may come with a steep learning curve, whereas others may be more user-friendly but lack advanced capabilities.
- Reporting: Ensure that the alternative solution provides comprehensive and understandable reports that aid in comprehending your system’s performance, and facilitating informed decision-making.
Best Site 24×7 Alternative
UptimeMonster
It presents the best alternative to Site24x7, even within its Free subscription tier, boasting a checking frequency as frequent as every 3 minutes, which can be further enhanced to 30-second intervals with higher-tier plans. UptimeMonster integrates the best practices in uptime monitoring, incident management, and downtime communication through status pages.
With UptimeRobot users gain access to a comprehensive array of features including HTTP(s) keyword checks, multi-step verification, heartbeat monitoring, SSL, Ping, and more.
Each error is meticulously documented with a screenshot and a detailed second-by-second timeline. UptimeMonster conducts checks on websites and servers every 25 seconds from multiple locations, significantly reducing the occurrence of false alarms or issues related to location discrepancies.
UptimeMonster check monitoring service will give you full control over your network. The check monitoring types are as follows
- TCP (Transmission Control Protocol)
- ICMP PING (Internet Control Message Protocol)
- IP Blacklist
- UDP (User Datagram Protocol)
- DNS (Domain Name Server)
- Application Monitoring
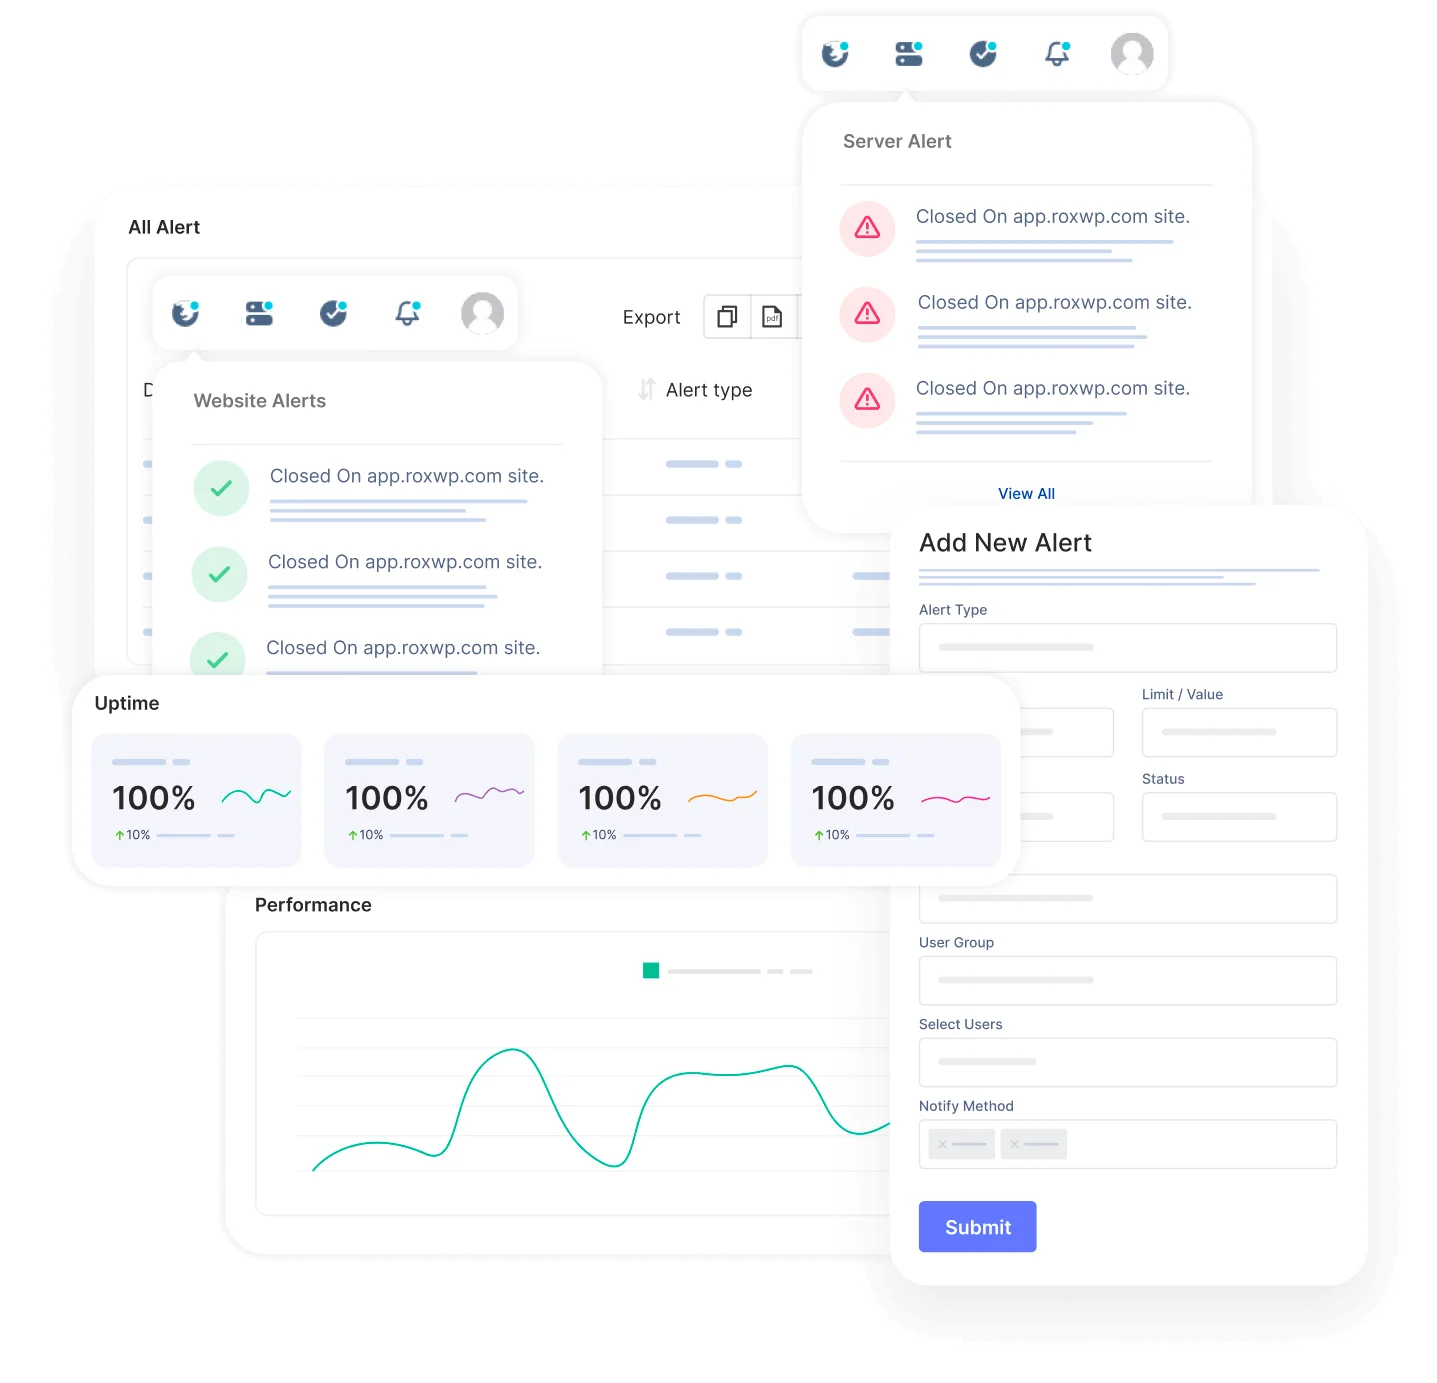
With a status page, you can share your monitoring activities and incidents with customers. You can easily make our status page public or private. You can highly customize your status page and share it with your customers to reduce the number of customer support tickets.
Using the status page you can easily gain trust from your customers. The alert notification easily notifies your customers about any incidents so that they can take necessary steps to prevent the issue. So that they will always be prepared and stay tuned.
Create and customize intricate policies for the escalation of incidents by taking into consideration various factors, including the passage of time, the availability of your team, and the source or origin of the incident.
The primary advantage, however, lies in integrated incident management and alerting. This is particularly advantageous for DevOps teams aiming to streamline their stack and potentially handle everything from a unified platform, eliminating the necessity for additional platforms.
Key Features
- Reliable Website and Server Monitoring
- Network Performance Monitoring
- Check Monitoring Types
- Status Page Customization
- Alert Notifications
- Incident Escalation Policies
- Incident Timeline
- SSL Expiration Monitoring
- Search String Monitoring
- Monitoring for HTTP(s), Ping, Port, DNS, SSL & TLD expiration, Cron jobs
- Unlimited email and push notification alerts
- Capture screenshots & error logs for incidents
Pros
- Reliable Uptime Monitoring
- Easy Setup and Configuration:
- Cost-Efficiency
- Customer Support:
- Accurate Reporting:
- User-Friendly Interface
- Customizable Alerts
- Status Page
- Escalation policies
- Incident Timeline Report
Cons
According to user reviews, UptimeMonster doesn’t exhibit any notable drawbacks. However, a few users have highlighted certain feature limitations present in the free plan offers. These limitations might include restricted access to certain functionalities or reduced capabilities compared to the premium plans. Despite this, the overall consensus from users is overwhelmingly positive regarding the platform’s performance and functionality.
Our perspective on this matter revolves around the notion that smaller teams might not necessitate the utilization of numerous advanced features. Therefore, it appears reasonable to curtail access to certain functionalities, considering that smaller teams might not require or fully utilize these advanced features. This approach ensures a streamlined and more focused user experience, optimizing the platform’s usability for smaller teams with specific needs.
Pricing
- Standard plan at $7/month with 30 monitors and 2-minute interval
- Professional plan at $19/month with 50 monitors and 1-minute interval
- Business plan at $99/month with 100 monitors and 25-second interval
Instatus
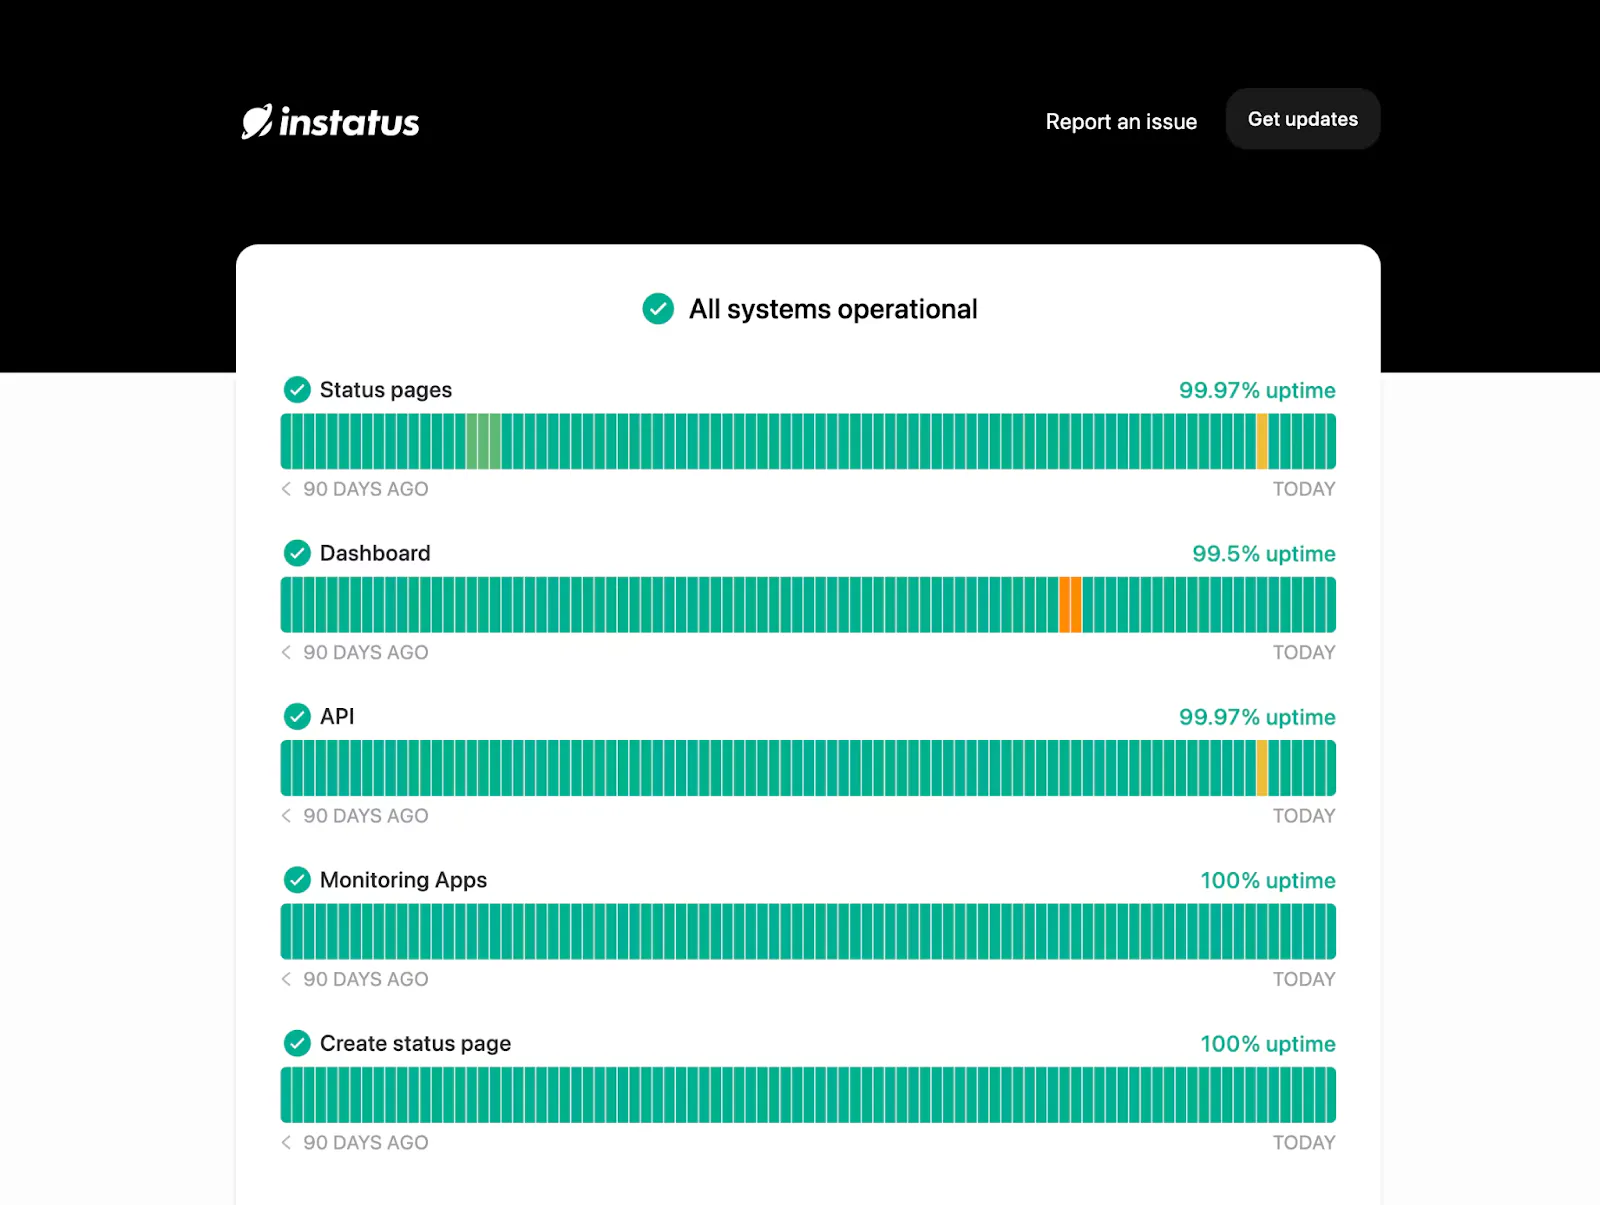
Instatus offers a comprehensive monitoring and incident management solution designed to keep your online services running smoothly. With support for various monitoring types such as website, API, keyword, SSL, TCP, ping, and DNS, Instatus ensures that any outages are promptly detected through rapid 30-second checks. Collaborative incident management tools enable teams to efficiently address issues and work on fixes. Additionally, integrated public and private status pages facilitate clear communication with customers during downtime, helping to maintain trust and transparency.
Key Features
- Monitoring Types: Monitor websites and applications using a range of methods including website, API, keyword, SSL, TCP, ping, and DNS monitoring, with rapid 30-second checks from multiple locations.
- Alerts: Receive timely notifications via email, SMS, or calls when issues occur. Integrate with communication tools such as Slack, Discord, and Teams for seamless alert delivery.
- Integrated Status Page: Keep users and team members informed about outages and maintenance activities through customizable public or private status pages.
- Monitoring Integrations: Easily link existing monitoring tools like Site24x7, Pingdom, and Datadog to streamline monitoring across all systems.
- Customizable Design: Brand your status page with custom colors, logos, and domain to align with your brand identity. Utilize CSS customization options to create a page that matches your product aesthetic.
Pros
- Comprehensive Monitoring
- Integrated Communication
- Customization Options
- Incident Management Tools
Cons
- Some features that are available on more popular providers’ free plans are unavailable on Instatus
- Support has been below expectations
- While Instatus offers integrations with various monitoring tools, users may encounter limitations or compatibility issues with certain third-party platforms.
Checkly
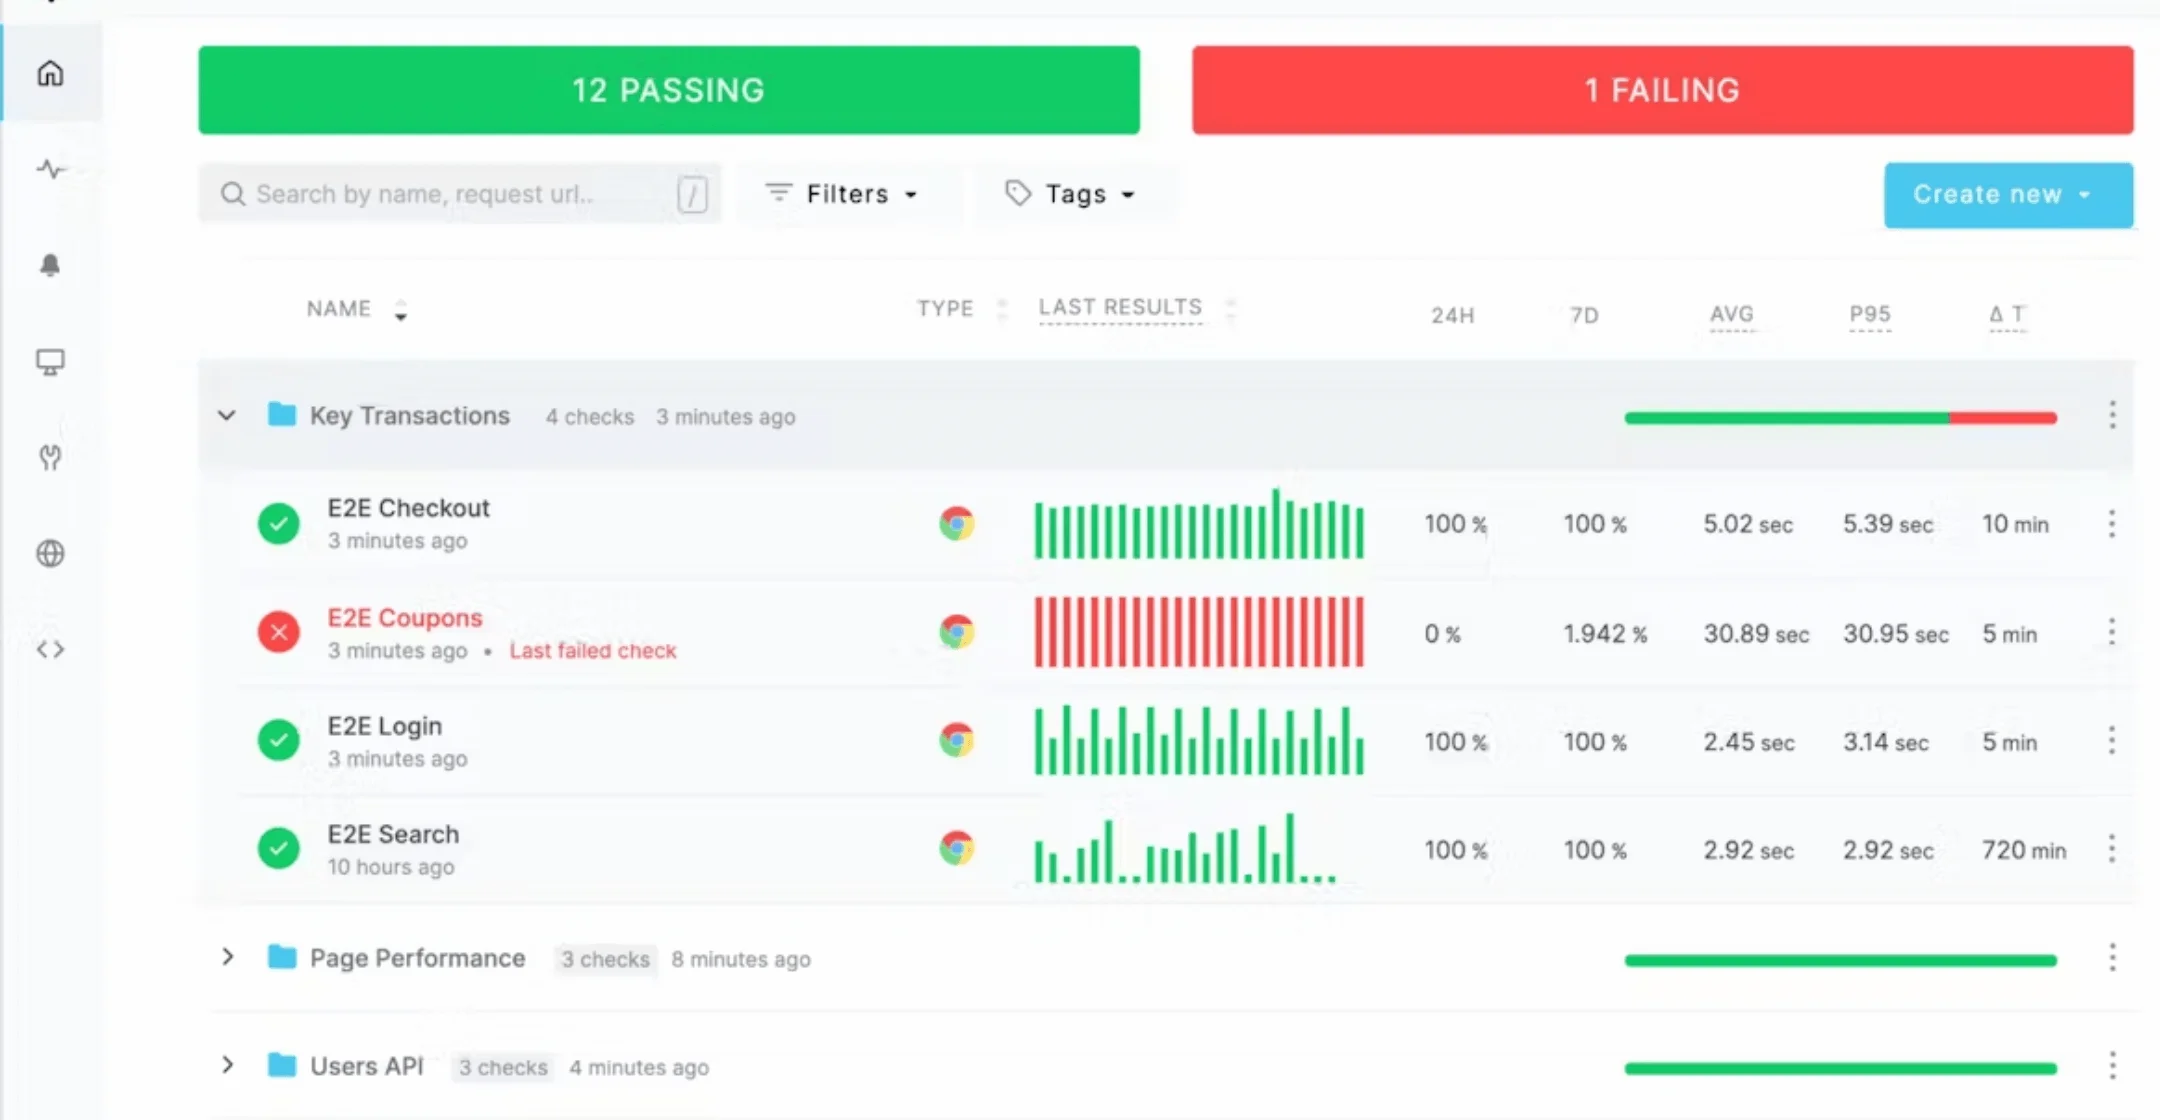
Checkly is a comprehensive platform for end-to-end and API monitoring. Leveraging Puppeteer and Playwright frameworks, Checkly precisely emulates interactions within a Chrome browser. Its browser checks enable thorough validation and measurement of web application performance, furnishing valuable data essential for debugging and optimization.
Key Features
- End-to-End and API Monitoring: Checkly offers comprehensive monitoring capabilities, covering both end-to-end and API aspects of your web application.
- Browser Simulation with Puppeteer & Playwright: Utilizing Puppeteer and Playwright frameworks, Checkly accurately simulates interactions with a Chrome browser, ensuring precise validation and performance measurement.
- Real Chrome Browsers: All checks run in real Chrome browsers within a sealed-off sandbox, enhancing security and reliability.
- Customizable API Checks: Run custom JavaScript before and after each API check, allowing for tailored monitoring setups.
- API Importers: Easily create API checks using Checkly’s cURL and Swagger API importers, simplifying the setup process.
Pros
- Free Plan
- Flexible Pricing
- Integration
- Security
- Open Source Tools
Cons
- While the free plan offers generous usage limits, users may encounter limitations with the number of API and browser check runs, potentially requiring an upgrade for larger-scale monitoring needs.
- Reliance on external platforms for alerting and integration may introduce complexities or dependencies on third-party services, requiring careful management and configuration.
ThousandEyes
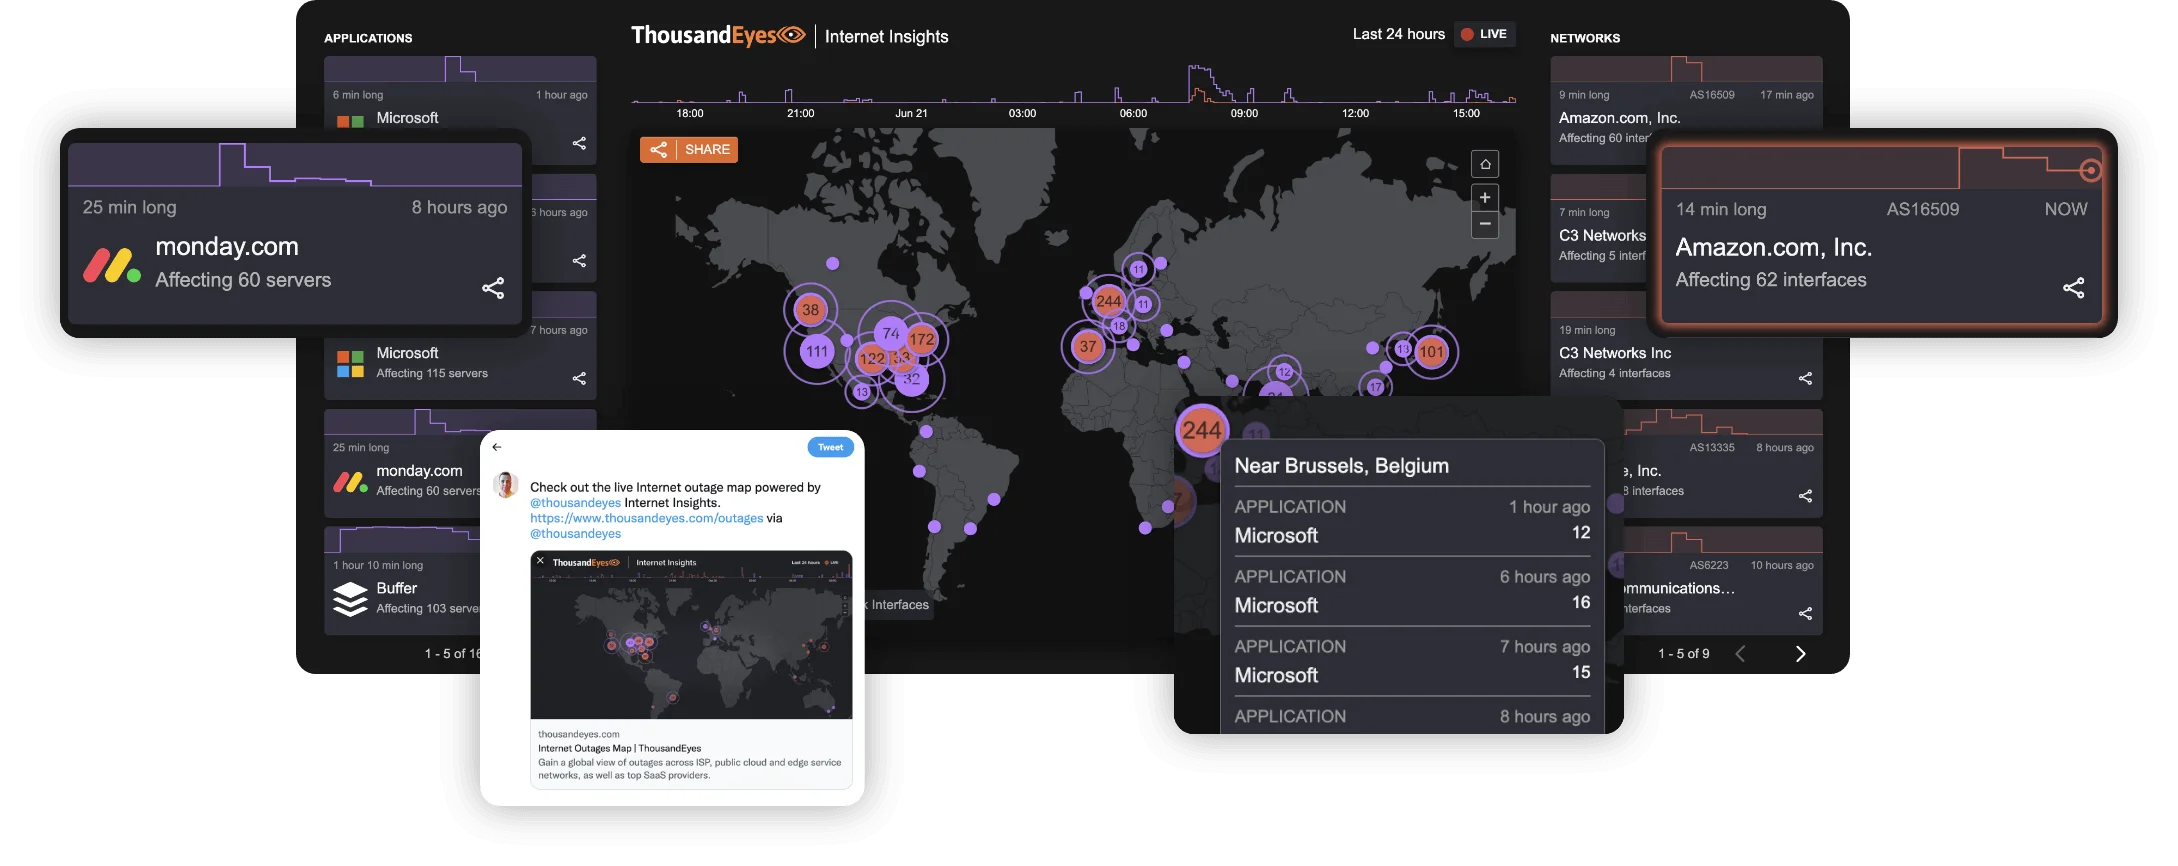
ThousandEyes empowers businesses to monitor, analyze, and optimize their network performance, ensuring seamless and reliable connectivity for users and applications alike.
With ThousandEyes, users gain unparalleled insights into every aspect of their network, from internal infrastructure to external services and cloud providers. The platform utilizes a combination of active and passive monitoring techniques to deliver comprehensive visibility into network behavior, identifying issues in real time and providing actionable insights for remediation.
Key Features
- Network Performance Monitoring: ThousandEyes offers comprehensive monitoring of network performance, allowing users to analyze key metrics such as latency, packet loss, and jitter across their entire infrastructure.
- Application Performance Monitoring (APM): The platform provides insights into application performance, including response times, error rates, and transaction success rates, enabling organizations to identify and address issues impacting user experience.
- Internet Outage Detection: ThousandEyes monitors internet connectivity and identifies outages affecting critical services, enabling proactive resolution and minimizing downtime.
- Cloud Service Monitoring: Users can monitor the performance of cloud-based services and applications, including SaaS platforms and public cloud providers, to ensure optimal performance and availability.
- DNS Analysis: ThousandEyes offers DNS monitoring and analysis tools to identify DNS-related issues impacting service delivery and user experience.
Pros
- Comprehensive Visibility
- Real-time Monitoring
- Proactive Alerting
- Global Coverage
- Customization and Reporting
Cons
- The platform may have a learning curve for new users due to its extensive feature set and complexity, requiring time and resources for training and familiarization.
- ThousandEyes may be cost-prohibitive for smaller organizations or those with limited budgets, particularly for advanced features and functionality.
- ThousandEyes’ effectiveness may be impacted by external factors such as network congestion, internet outages, and cloud service availability, limiting its ability to provide accurate insights in certain situations.
- While ThousandEyes offers customization options for reports and dashboards, some users may find the level of customization limited compared to other monitoring solutions.
Seamtext
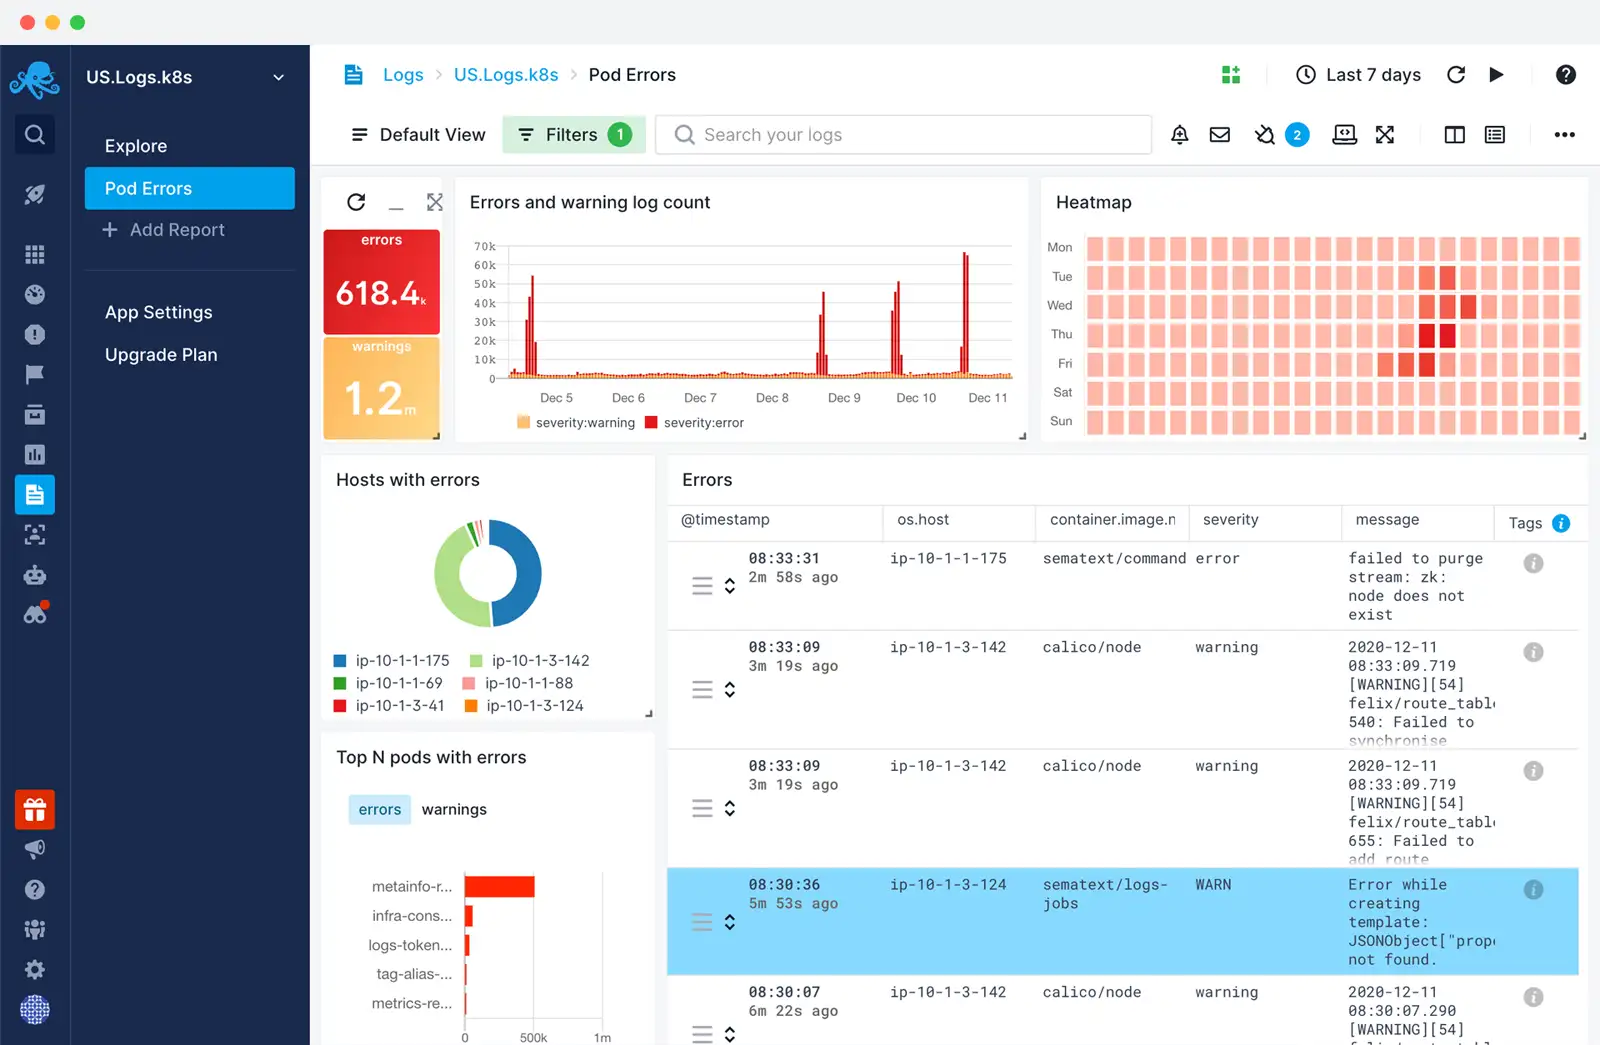
Sematext is a monitoring and logging service, that provides a centralized platform for aggregating and storing logs from diverse data sources. This comprehensive solution enables users to seamlessly collect data from servers, applications, databases, containers, and various systems, consolidating them into a unified location. A distinctive feature of Sematext is its real-time log viewing capability, allowing users to monitor logs as they arrive in the cloud from multiple data streams.
Utilizing Elasticsearch, Logstash, and Kibana, Sematext excels in collecting, transforming, searching, filtering, analyzing, and visualizing data. The platform offers a real-time alerting system for both metrics and logs, facilitating faster troubleshooting. The integration of log analysis and anomaly detection further streamlines the overall process, enhancing efficiency.
Running on AWS, Sematext adheres to stringent IT security best practices, ensuring the safety of your logs. The encryption of logs via HTTPS and transmission through TLS/SSL channels adds an extra layer of security. Moreover, the platform offers the ability to assign specific permissions to team members, enhancing the integrity and security of the overall service.
Pros
- Easy to navigate with a nice interface
- The integration process was expedited significantly due to the availability of pre-built Java and Android libraries, ready for immediate use.
- Provide Docker Metrics and Docker Logs
Cons
- Not enough documentation for old OS
- The monitor deployment process is complex
- Pricing Complexity
- Limited Free Tier
Pricing
- Standard Plan – $50/month
- Pro Plan – $60/month
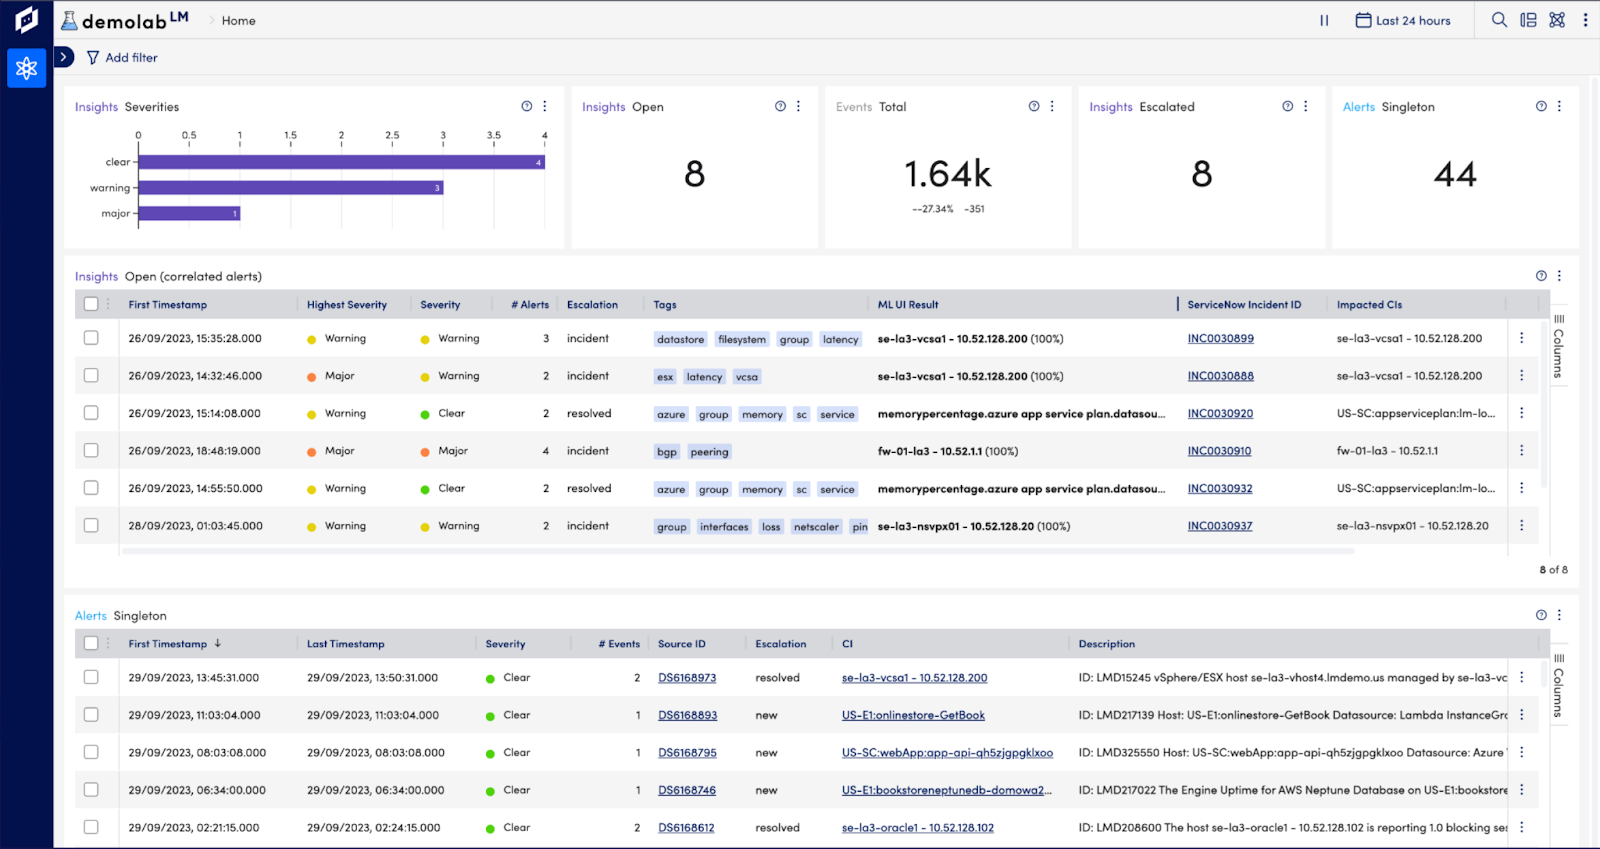
LogicMonitor
LogicMonitor presents an expansive solution, delivering log intelligence at a scale specifically tailored for hybrid and multi-cloud environments. The platform excels in centralizing, correlating, and contextualizing data, prioritizing data hygiene and internal compliance to ensure a comprehensive and compliant log management experience.
One notable feature of LogicMonitor is its capability to centralize monitoring activities, enabling users to seamlessly correlate pertinent logs with metrics within a singular platform. This integrated approach enhances the overall coherence of monitoring efforts, fostering a more holistic understanding of system performance.
Pros
- Wide range of vendor equipment supported
- Modules can be customized
- Agent or agentless monitoring
- Security features
Cons
- Changing the alerting settings is difficult
- No prebuilt alerts and templates are provided
- Customization Complexity
- Expensive
- Doesn’t provide any detailed reporting
- Mobile app not user-friendly
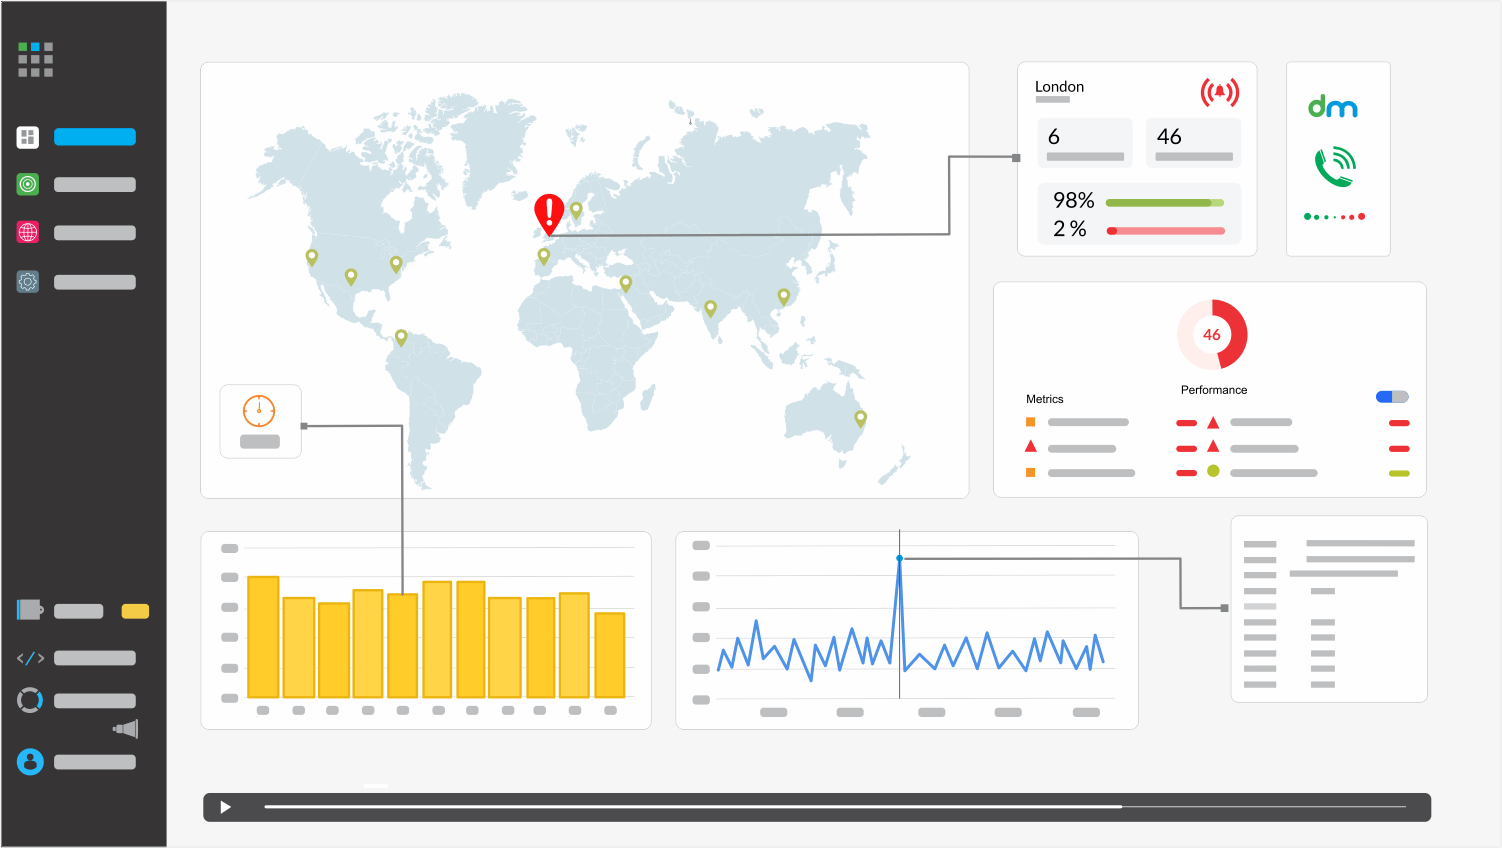
Dotcom-Monitor
Dotcom-monitor stands out as a comprehensive monitoring platform, providing meticulous oversight of web page, application, and server uptime and performance. The platform offers four distinct plans, categorized based on capabilities and use-case scenarios rather than a tiered structure.
The Web Services plan is tailored for users seeking fundamental uptime, ping, and SSL monitoring. Priced at $20 per month, this plan allows for 1-minute checks from 30 locations, offering a reliable and cost-effective solution for basic monitoring needs.
On the other hand, the Web Pages plan, starting at $30/month, places a heightened focus on page load times and various client performance metrics. This plan caters to users keen on analyzing factors such as browser types and DNS connections to gain a more comprehensive understanding of web page performance.
Dotcom-monitor’s approach of offering plans based on specific monitoring requirements ensures users can choose a package that aligns precisely with their needs, making it a flexible and user-centric monitoring solution.
Pros
- API Monitoring
- Easy setup and customization
- Single web page monitoring
- Detailed reporting
- Easy integration
Cons
- Complex user workflows for SaaS apps
- UI is a little bit confusing for new users
- Inconsistency in server response time reading
- Pricing
Pricing
- Basic package – $29.99/month
- Standard package – $55.99/month
- Advanced package – $129/month
New Relic
With New Relic, you can get a real-time, comprehensive understanding of your network, infrastructure, applications, end-user experience, machine learning models, and beyond. You can also attain total application visibility, spanning from backend APIs to frontend devices. Whether on-premises or in the cloud, access in-depth visibility into your infrastructure within a unified platform. New Relic also offers effortless management and analysis of logs, enhancing your overall system monitoring capabilities.
Key features of New Relic
- Application Performance Monitoring (APM)
- Infrastructure Monitoring
- Synthetic Monitoring
- Error Tracking
- Full-Stack Observability
- Dashboards and Reporting
- Alerting and Notification
Pros
- Flexible solutions
- Dynamic reporting
- Graph view of distributed tracing
- Error logging
- The agent is easy to configure and maintain.
- Integrations
Cons
- Hard to use & help resources are slim
- Pricing is confusing
- PHP error logging misses the first line of stack traces
- No Longer data history
- Complex interface
- Alert configuration is complex
- Create False Alarms if the alert is not configured properly
Pricing
- The Data Plus option charges $0.50 per GB of data you ingest into New Relic. It costs $0.55 per GB if you choose to store your data in the EU region
- It starts at $49 per month for the Standard edition of New Relic. Pro and Enterprise editions offer custom pricing.
- New Relic offers one free full-platform user, regardless of which New Relic Edition you pick. You get one full platform user with the Standard Edition, then $99 per user after. You can add up to five users with a Standard Edition.
