

10 Best Better Stack Alternatives in 2024
![]() 12 Mins Read
12 Mins Read
Looking for the best Better Stack alternatives?
What is Better Stack?
Better Uptime stands as a website monitoring solution that empowers businesses to proficiently monitor errors or issues, efficiently manage incidents, and convey real-time system status updates to customers via personalized branded pages.
Better Stack offers real-time monitoring and analysis of your entire technology stack, providing valuable insights into the health and efficiency of your systems. It’s capable of monitoring diverse technology stacks, accommodating a wide range of applications, databases, servers, and network components. The alerting system promptly notifies administrators of potential issues. This feature helps proactively address problems before they escalate, minimizing the impact on end-users.
Whether your infrastructure is small or large, the Better Stack Monitoring Tool scales effortlessly to meet the demands of your growing organization. This scalability ensures that the tool remains effective as your IT environment evolves.
Better Stack serves as a valuable tool for end users with important features and functionalities. However, it’s essential to note that despite its strengths, there exist both minor and major weaknesses within the platform.

Limitations and Challenges of Better Stack
- Don’t have a dashboard with the current status of every monitor you set up
- Ideal to use for a few sites, but It’s a little clumsy when you have 100+ sites.
- Response time across the regions is for the last 24 hours
- Advanced users who require highly specialized monitoring configurations may find the tool’s customization options somewhat limiting. This could be a drawback for organizations with extremely unique or complex IT environments.
- Implementing and fully utilizing the tool may require a learning curve for users who are not familiar with its interface and features.
- Limited functionality
Key Considerations When Exploring Alternatives to Better Stack
Selecting the right monitoring solution involves thoughtful consideration of various criteria to ensure it aligns with your unique needs. Here are crucial factors to weigh:
Functionality: The effectiveness of a monitoring solution hinges on its functionality, dictating the breadth of features it provides. Seek alternatives that offer comprehensive functionality tailored to meet your specific monitoring requirements.
Price: Assess the pricing structures of alternatives to Better Uptime to ensure optimal value for your investment while retaining essential features.
User Experience: Prioritize alternatives that prioritize a seamless user experience, facilitating easy navigation and efficient management of monitoring tasks.
Integrations: Explore platforms that boast a diverse range of integrations, enabling the creation of a cohesive monitoring ecosystem with existing systems.
Support: Reliable and responsive customer support is crucial for timely issue resolution. Choose alternatives that offer comprehensive support channels to meet your needs effectively.
Features and Capabilities: Evaluate the features provided by alternatives and select a solution aligned with your specific monitoring requirements.
Scalability: Opt for alternatives that offer scalability, allowing for the easy expansion of monitoring capabilities as your operations grow.
Reporting and Analytics: Seek monitoring solutions that provide robust reporting and analytics features, enabling insightful data analysis for informed decision-making.
By considering these criteria, you can make an informed choice when exploring alternatives to Better Uptime, ensuring that the selected monitoring solution caters to your organization’s distinct needs and preferences.
Best Alternative for Better Stack
UptimeMonster
Reliable website and server monitoring service from the cloud to monitor your web availability, performance, and security. The tool will give you a 24/7 website monitoring service that will Monitor the availability of your website, APIs, and business-critical web transactions with powerful synthetic monitoring and testing tools.
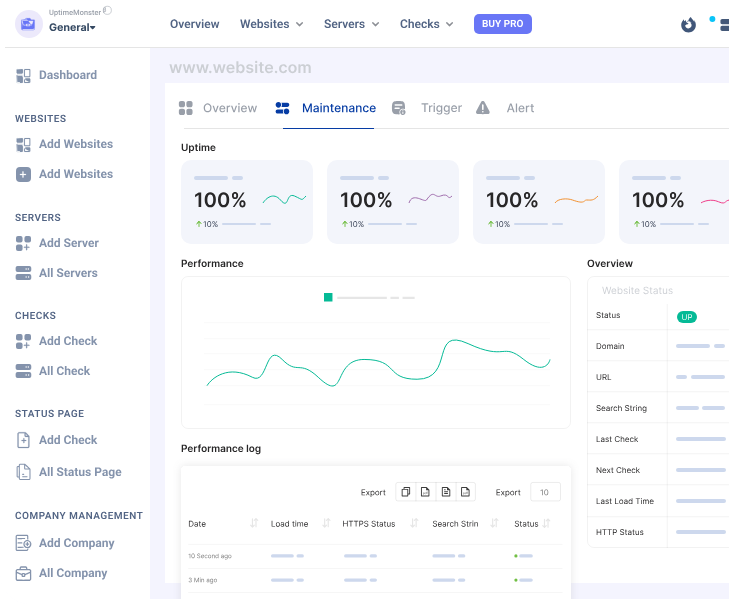
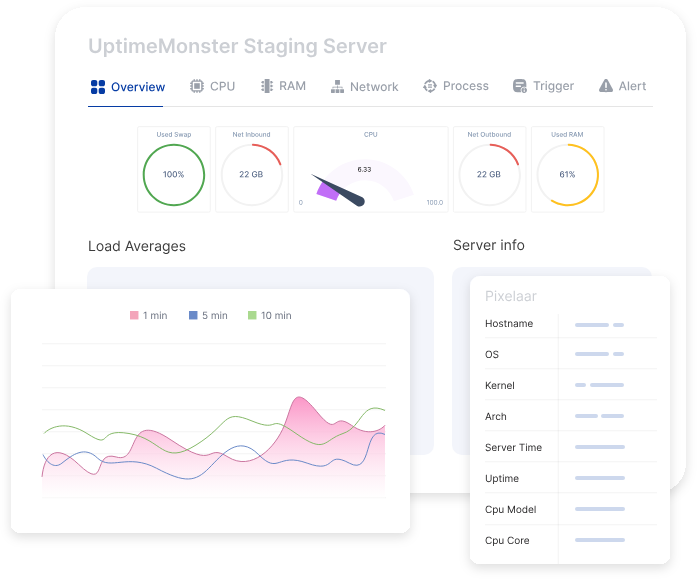
It collects, correlates, and monitors servers alongside data from the rest of your stack. UptimeMonster server monitoring allows you to visualize, analyze, and track down different query metrics happening on your server so that you can prevent them before anything goes wrong.
Monitor your network performance like IP, DNS, Service port, Application, and others using the check monitoring tools. It will enable you to understand the network behavior and track NetFlow.
UptimeMonster check monitoring service will give you full control over your network. The check monitoring types are as follows
- TCP (Transmission Control Protocol)
- ICMP PING (Internet Control Message Protocol)
- IP Blacklist
- UDP (User Datagram Protocol)
- DNS (Domain Name Server)
- Application Monitoring
With a status page, you can share your monitoring activities and incidents with customers. You can easily make our status page public or private. You can highly customize your status page and share it with your customers to reduce the number of customer support tickets.
Using the status page you can easily gain trust from your customers. The alert notification easily notifies your customers about any incidents so that they can take necessary steps to prevent the issue. So that they will always be prepared and stay tuned.
Create and customize intricate policies for the escalation of incidents by taking into consideration various factors, including the passage of time, the availability of your team, and the source or origin of the incident.
Pros
- Reliable Uptime Monitoring
- Easy Setup and Configuration:
- Cost-Efficiency
- Customer Support:
- Accurate Reporting:
- User-Friendly Interface
- Customizable Alerts
- Status Page
- Escalation policies
- Incident Timeline Report
Cons
According to user reviews, UptimeMonster doesn’t exhibit any notable drawbacks. However, a few users have highlighted certain feature limitations present in the free plan offering. These limitations might include restricted access to certain functionalities or reduced capabilities compared to the premium plans. Despite this, the overall consensus from users is overwhelmingly positive regarding the platform’s performance and functionality.
Our perspective on this matter revolves around the notion that smaller teams might not necessitate the utilization of numerous advanced features. Therefore, it appears reasonable to curtail access to certain functionalities, considering that smaller teams might not require or fully utilize these advanced features. This approach ensures a streamlined and more focused user experience, optimizing the platform’s usability for smaller teams with specific needs.
Pricing
- Standard plan at $7/month with 30 monitors and 2-minute interval
- Professional plan at $19/month with 50 monitors and 1-minute interval
- Business plan at $99/month with 100 monitors and 25-second interval
DataDog
Datadog’s website monitoring stands out as a comprehensive solution that offers unparalleled visibility. It goes beyond mere aggregation by seamlessly collecting metrics and events from an extensive range of over 500 integrated technologies, tagging and storing them for further analysis.
Notably, Datadog streamlines the entire process by taking care of the ingestion, normalization, and enrichment of logs, allowing users to focus on deriving meaningful insights rather than grappling with technical intricacies. This ensures a user-friendly experience and maximizes the efficiency of log management operations.
Furthermore, Datadog doesn’t stop at threat identification; it actively tracks the performance impact of every deployed code. This automated tracking extends to mapping data flows and dependencies through a service map, offering a visual representation of the intricate relationships within the infrastructure. By doing so, Datadog not only ensures robust security but also provides valuable insights into the operational dynamics of the entire system.
Pros
- Real-time log tracking
- Security monitoring
- Integrations
- Alerting system
- Custom downtime for deployment
Cons
- The primary weakness of Datadog lies in its scaling capabilities. Increasing metrics monitoring necessitates additional monitors, significantly impacting monthly billing and leading to high expenses.
- Datadog’s complexity might pose challenges, particularly for users unfamiliar with monitoring systems. Navigating and finding specific functionalities can be challenging without prior experience.
- Immediate action is lacking when decommissioning a host. It takes up to 24 hours for a host to be officially removed from the list, causing delays in real-time updates upon decommissioning.
- The basic plugins in Datadog offer limited information. Users often need to configure their plugins to obtain more detailed reports, adding complexity to data retrieval.
- Graphical reports in Datadog are not intuitively comprehensive, failing to provide easily understandable and valuable information to users.
Pricing
- Pro package at $15 per host/er month
- Enterprise package at $23 per host/per month
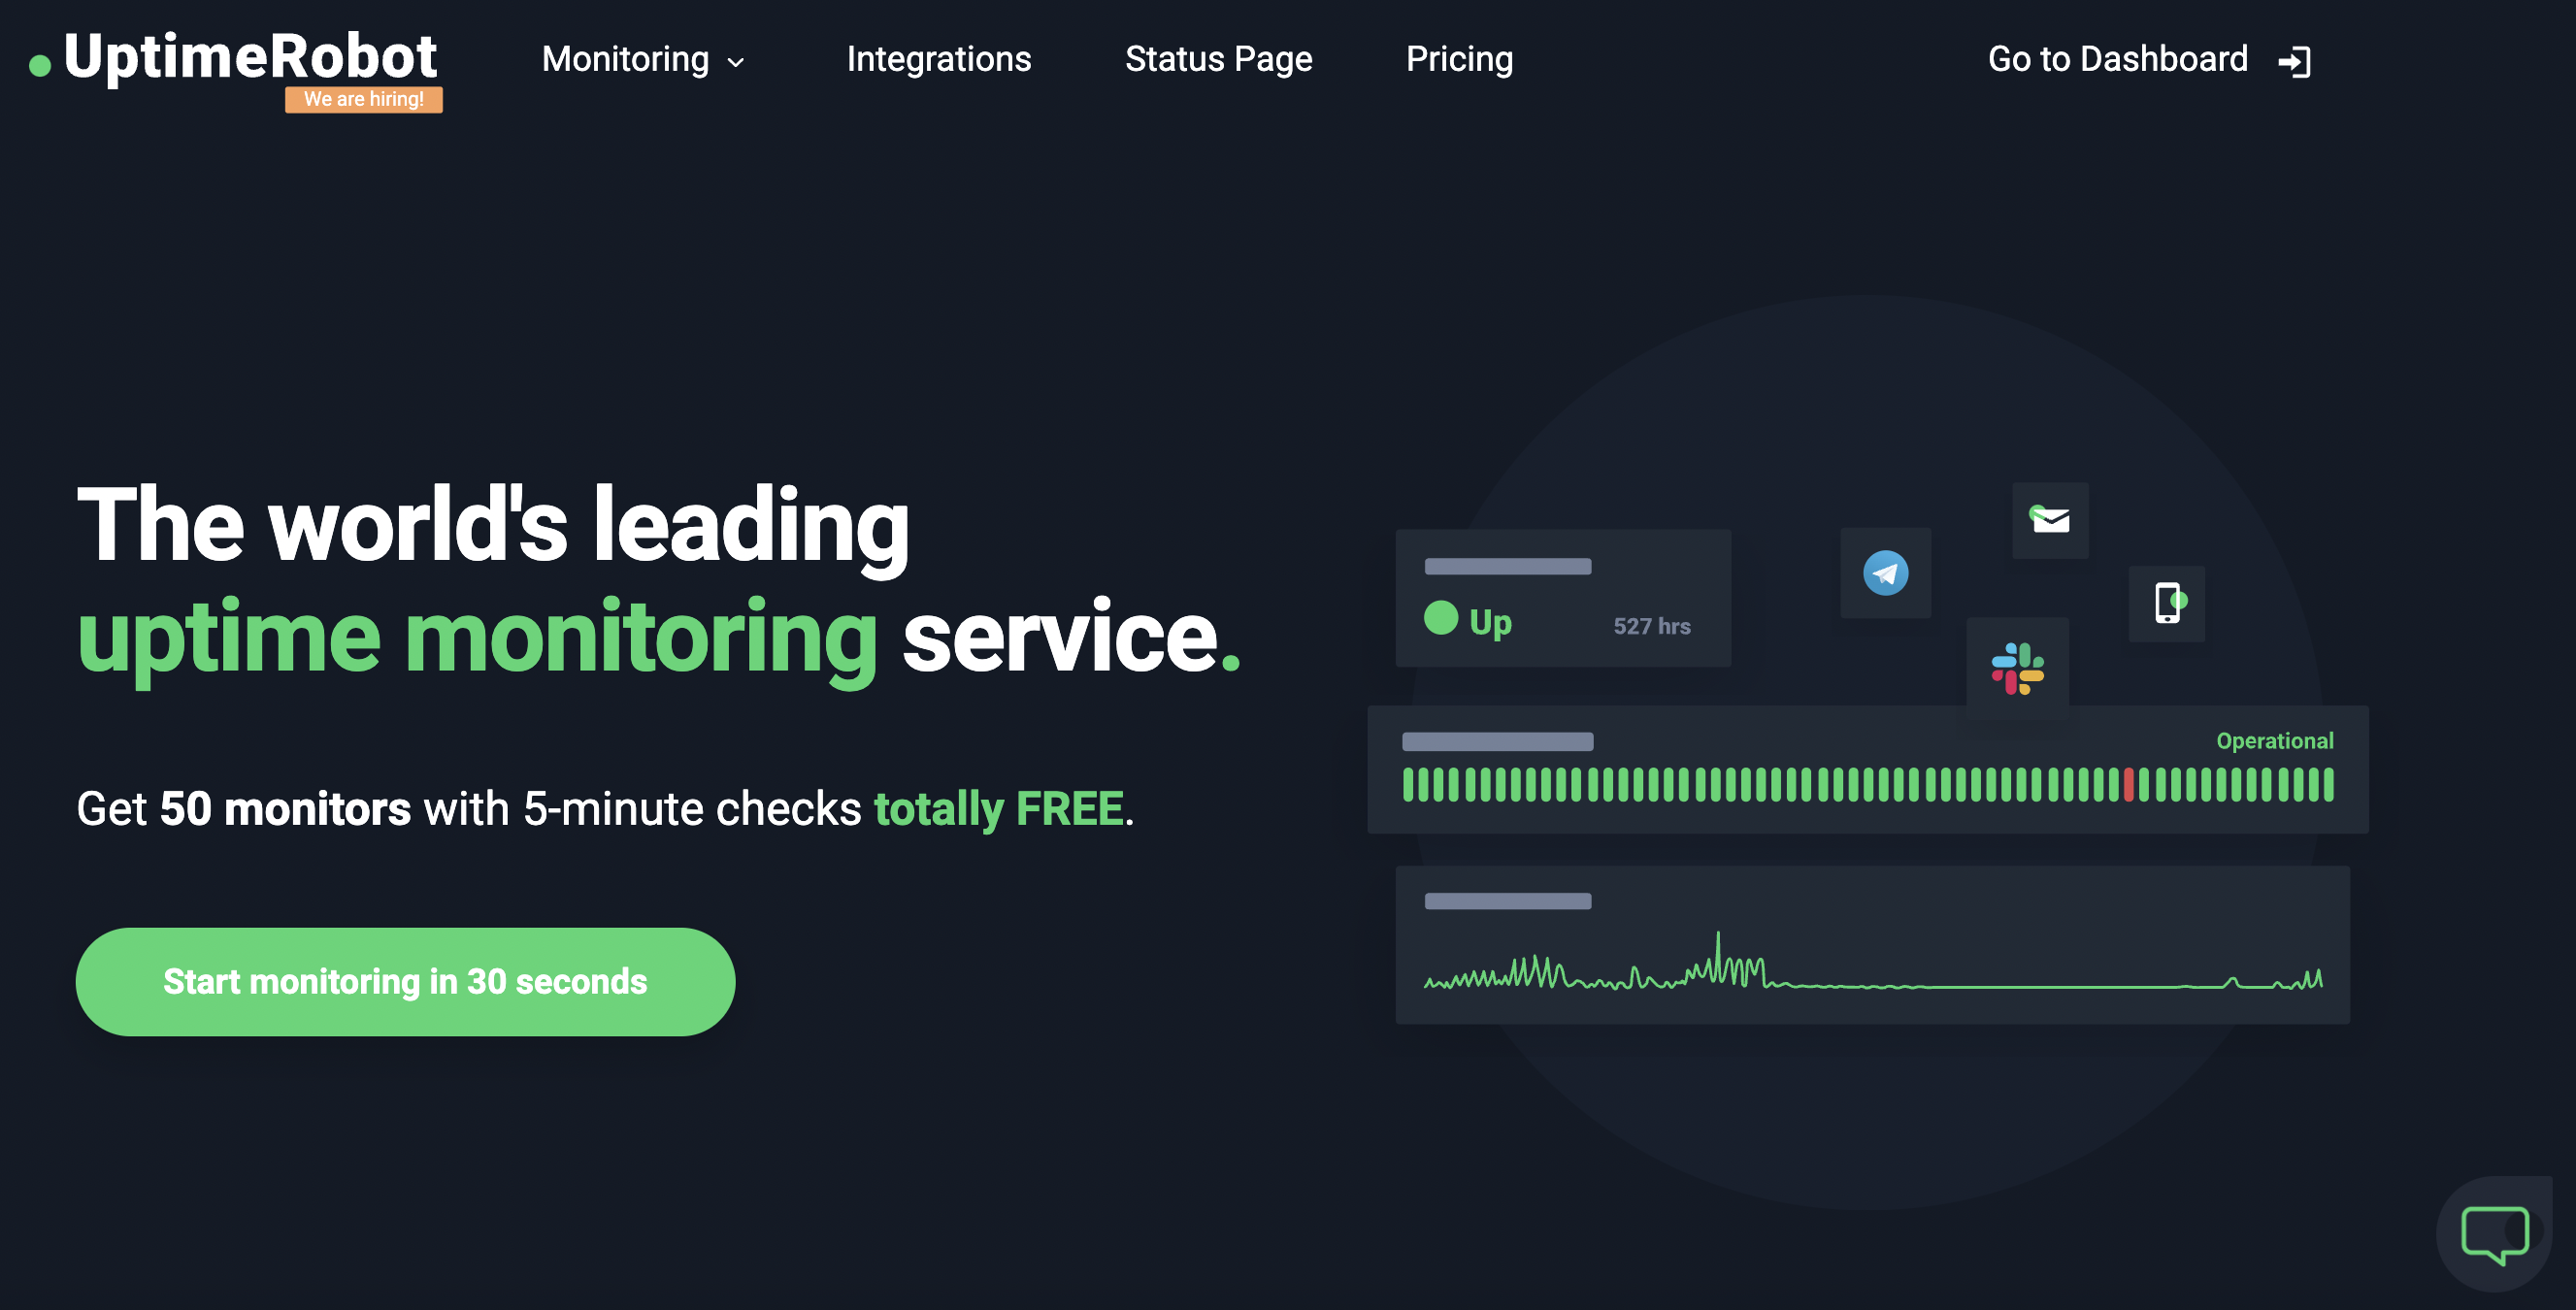
UptimeRobot
UptimeRobot detects downtime, allowing users to receive instant alerts and take necessary action. It offers a diverse range of monitoring options, including HTTP(s), Ping, TCP, and more, UptimeRobot is a solution suitable for various digital assets. Its intuitive interface, coupled with customizable alerting features, makes it an essential tool for businesses and individuals seeking to maintain a reliable and uninterrupted online presence.
Key features of UptimeRobot
- Website Monitoring
- Multiple Monitoring Intervals
- Alerting and Notifications
- Multiple Monitoring Locations
- Status Page
- SSL Monitoring
- Customizable Reports
- API Access
Pros of UptimeRobot
- Easy of use
- Reliable dashboard and easy setup
- Public status page
- Various alerting options
- Integration with other tools
- Customer support
Cons of UptimeRobot
- Limited Functionality in Free Plan
- Limited Advanced Monitoring Features
- Potential Monitoring Delays
- Dependency on External Integrations
- Limited Customization
- No export data feature
- UI can be improved
- Alerts are dispatched in increments of 5 or 10 minutes, resulting in uptime information being displayed in multiples of 5, even if the server has been up for only 2 minutes.
Pricing
- Solo package cost $7/month with 10 monitors
- Team package cost $29/month with 1000 monitors
- The enterprise package costs $54/month with 200 monitors
Seamtext
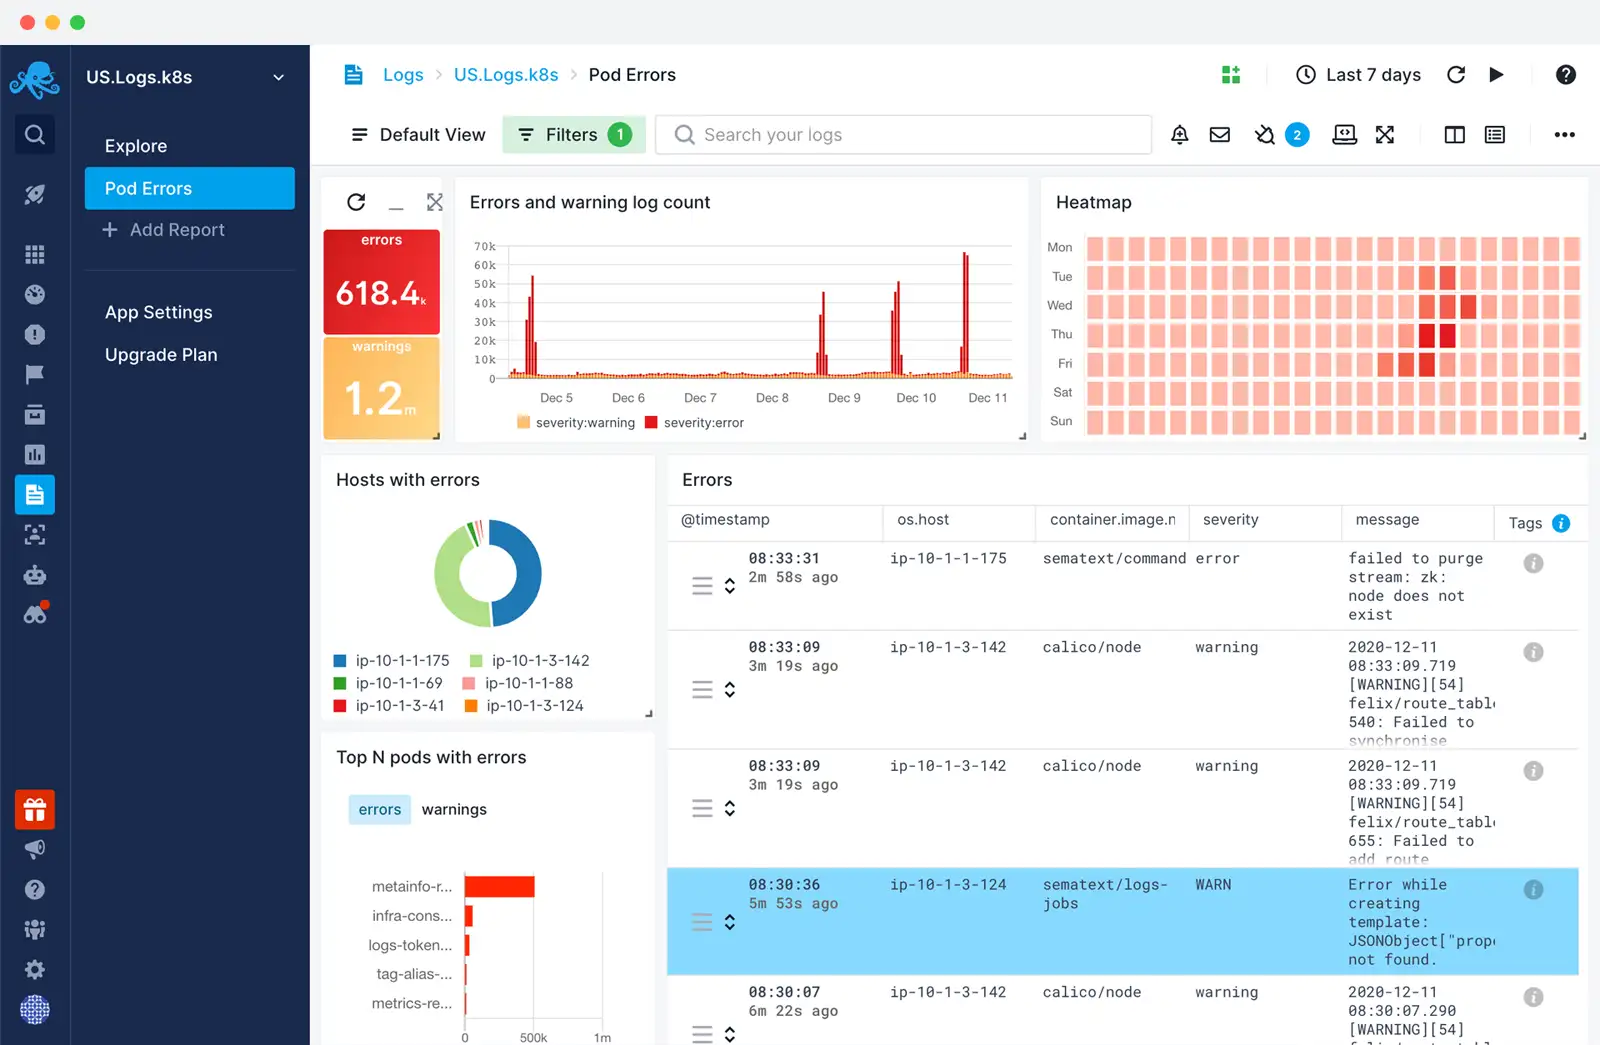
Sematext is a monitoring and logging service, that provides a centralized platform for aggregating and storing logs from diverse data sources. This comprehensive solution enables users to seamlessly collect data from servers, applications, databases, containers, and various systems, consolidating them into a unified location. A distinctive feature of Sematext is its real-time log viewing capability, allowing users to monitor logs as they arrive in the cloud from multiple data streams.
Utilizing Elasticsearch, Logstash, and Kibana, Sematext excels in collecting, transforming, searching, filtering, analyzing, and visualizing data. The platform offers a real-time alerting system for both metrics and logs, facilitating faster troubleshooting. The integration of log analysis and anomaly detection further streamlines the overall process, enhancing efficiency.
Running on AWS, Sematext adheres to stringent IT security best practices, ensuring the safety of your logs. The encryption of logs via HTTPS and transmission through TLS/SSL channels adds an extra layer of security. Moreover, the platform offers the ability to assign specific permissions to team members, enhancing the integrity and security of the overall service.
Pros
- Easy to navigate with a nice interface
- The integration process was expedited significantly due to the availability of pre-built Java and Android libraries, ready for immediate use.
- Provide Docker Metrics and Docker Logs
Cons
- Not enough documentation for old OS
- The monitor deployment process is complex
- Pricing Complexity
- Limited Free Tier
Pricing
- Standard Plan – $50/month
- Pro Plan – $60/month
LogicMonitor
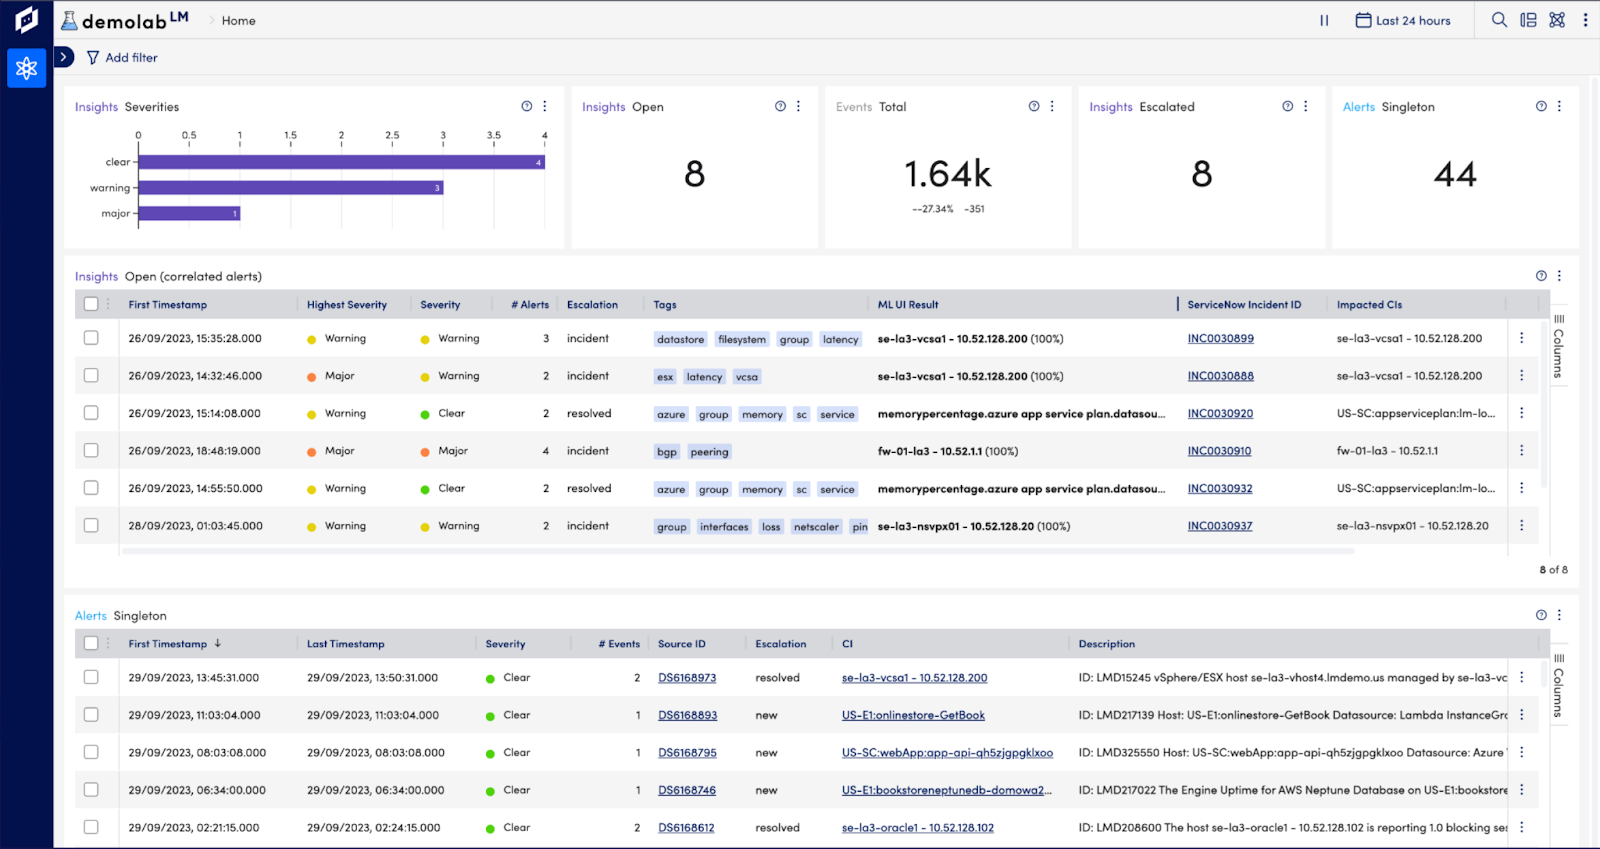
LogicMonitor presents an expansive solution, delivering log intelligence at a scale specifically tailored for hybrid and multi-cloud environments. The platform excels in centralizing, correlating, and contextualizing data, prioritizing data hygiene and internal compliance to ensure a comprehensive and compliant log management experience.
One notable feature of LogicMonitor is its capability to centralize monitoring activities, enabling users to seamlessly correlate pertinent logs with metrics within a singular platform. This integrated approach enhances the overall coherence of monitoring efforts, fostering a more holistic understanding of system performance.
Pros
- Wide range of vendor equipment supported
- Modules can be customized
- Agent or agentless monitoring
- Security features
Cons
- Changing the alerting settings is difficult
- No prebuilt alerts and templates are provided
- Customization Complexity
- Expensive
- Doesn’t provide any detailed reporting
- Mobile app not user-friendly
Dotcom-Monitor
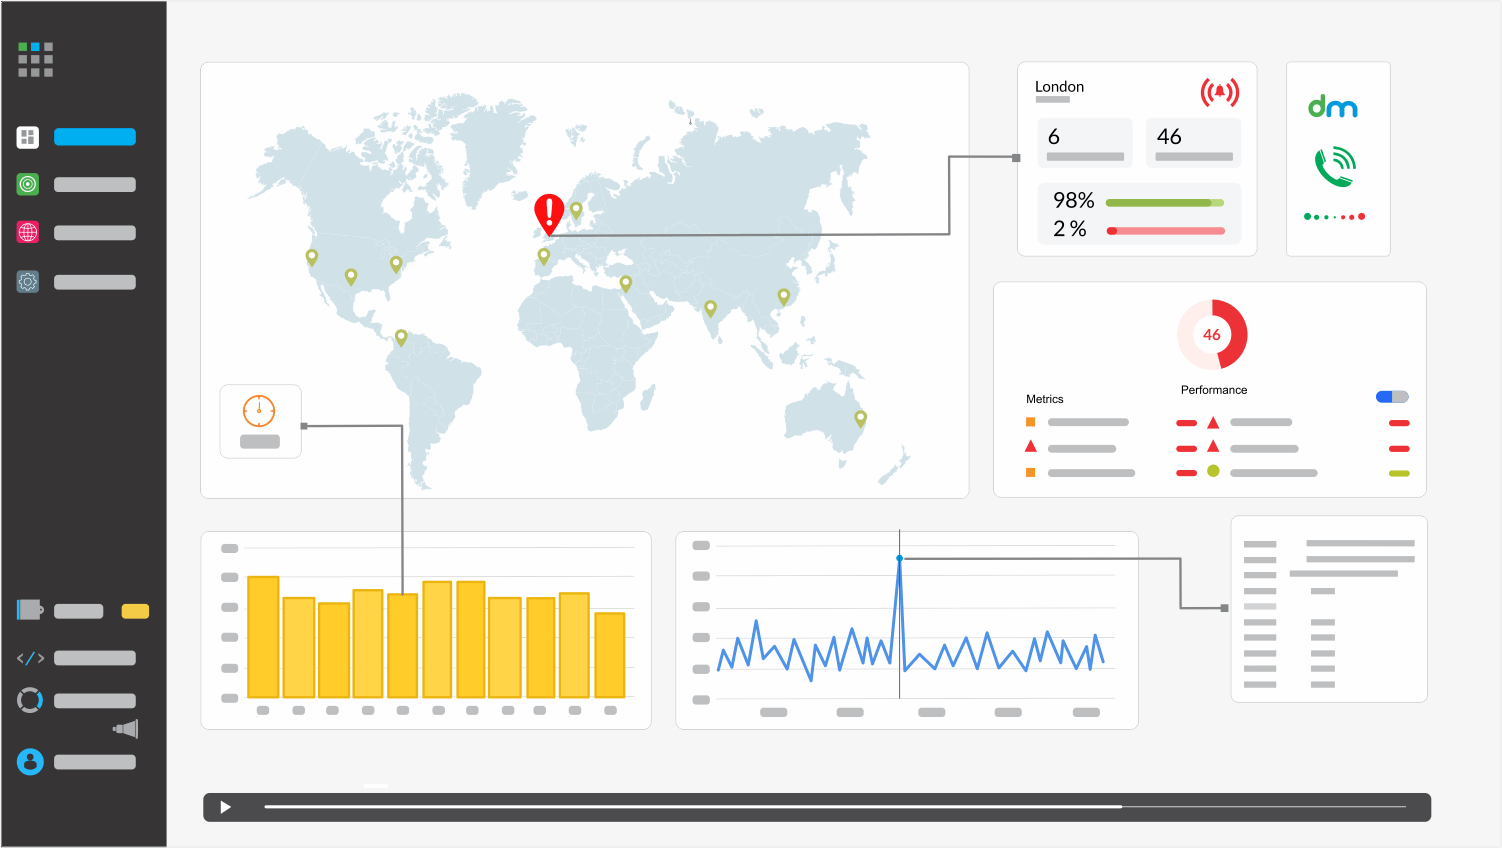
Dotcom-monitor stands out as a comprehensive monitoring platform, providing meticulous oversight of web page, application, and server uptime and performance. The platform offers four distinct plans, categorized based on capabilities and use-case scenarios rather than a tiered structure.
The Web Services plan is tailored for users seeking fundamental uptime, ping, and SSL monitoring. Priced at $20 per month, this plan allows for 1-minute checks from 30 locations, offering a reliable and cost-effective solution for basic monitoring needs.
On the other hand, the Web Pages plan, starting at $30/month, places a heightened focus on page load times and various client performance metrics. This plan caters to users keen on analyzing factors such as browser types and DNS connections to gain a more comprehensive understanding of web page performance.
Dotcom-monitor’s approach of offering plans based on specific monitoring requirements ensures users can choose a package that aligns precisely with their needs, making it a flexible and user-centric monitoring solution.
Pros
- API Monitoring
- Easy setup and customization
- Single web page monitoring
- Detailed reporting
- Easy integration
Cons
- Complex user workflows for SaaS apps
- UI is a little bit confusing for new users
- Inconsistency in server response time reading
- Pricing
Pricing
- Basic package – $29.99/month
- Standard package – $55.99/month
- Advanced package – $129/month
New Relic
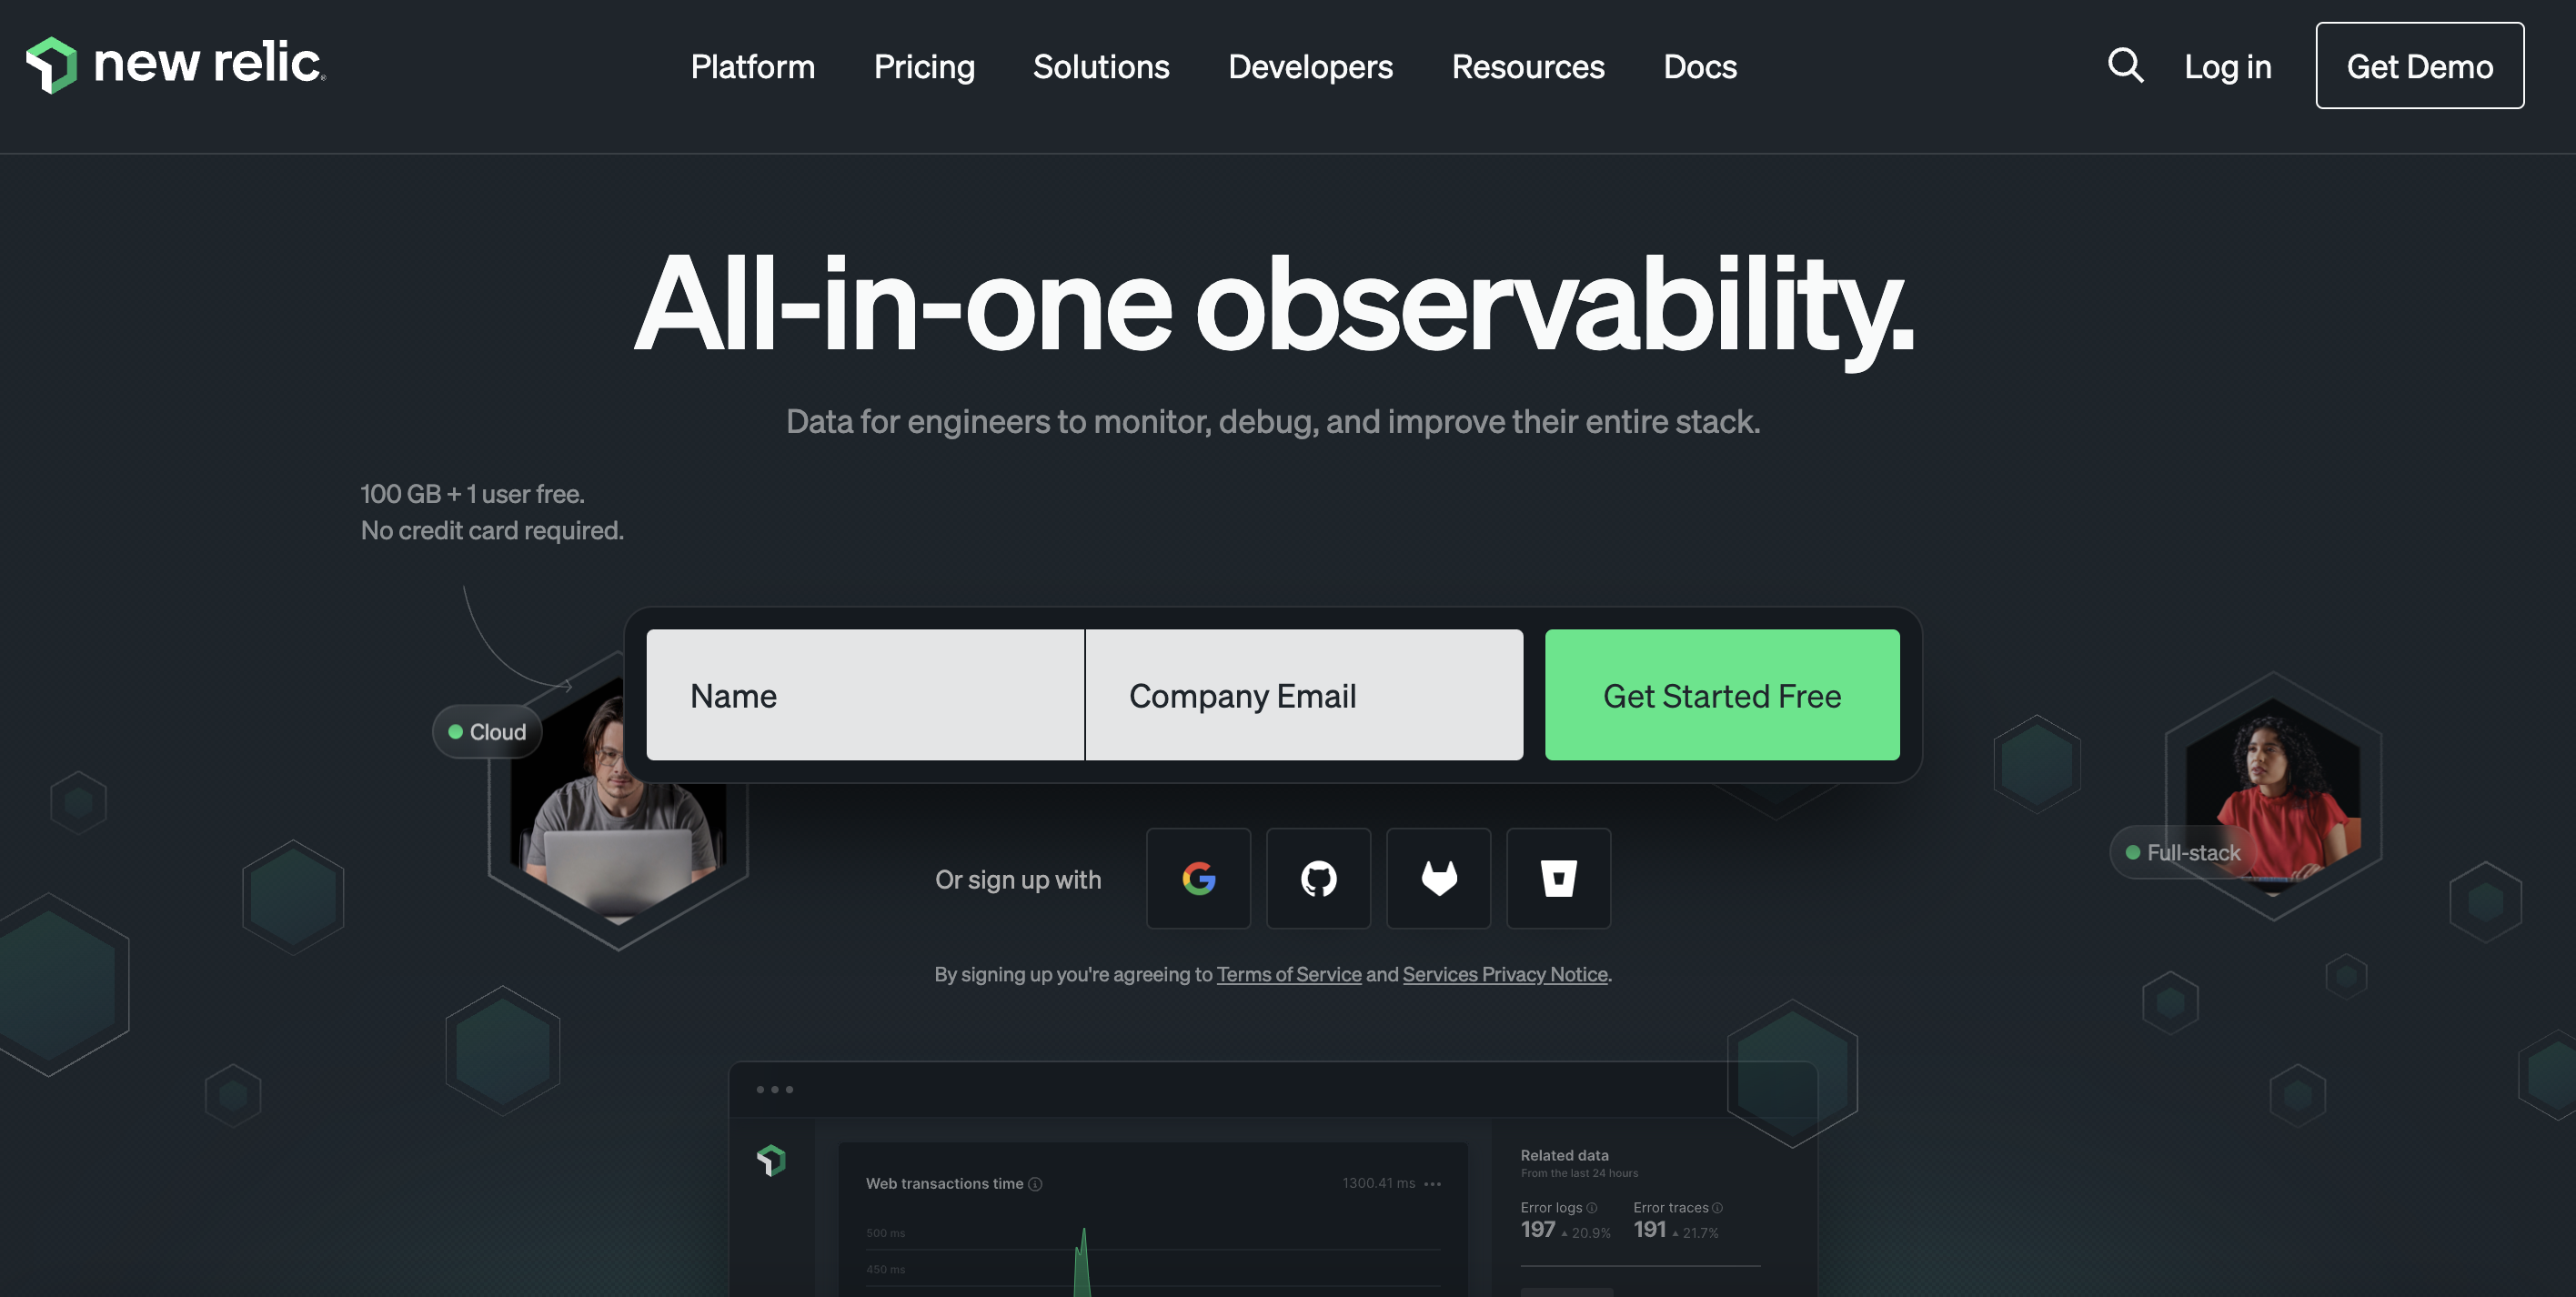
With New Relic, you can get a real-time, comprehensive understanding of your network, infrastructure, applications, end-user experience, machine learning models, and beyond. You can also attain total application visibility, spanning from backend APIs to frontend devices. Whether on-premises or in the cloud, access in-depth visibility into your infrastructure within a unified platform. New Relic also offers effortless management and analysis of logs, enhancing your overall system monitoring capabilities.
Key features of New Relic
- Application Performance Monitoring (APM)
- Infrastructure Monitoring
- Synthetic Monitoring
- Error Tracking
- Full-Stack Observability
- Dashboards and Reporting
- Alerting and Notification
Pros
- Flexible solutions
- Dynamic reporting
- Graph view of distributed tracing
- Error logging
- The agent is easy to configure and maintain.
- Integrations
Cons
- Hard to use & help resources are slim
- Pricing is confusing
- PHP error logging misses the first line of stack traces
- No Longer data history
- Complex interface
- Alert configuration is complex
- Create False Alarms if the alert is not configured properly
Pricing
- The Data Plus option charges $0.50 per GB of data you ingest into New Relic. It costs $0.55 per GB if you choose to store your data in the EU region
- It starts at $49 per month for the Standard edition of New Relic. Pro and Enterprise editions offer custom pricing.
- New Relic offers one free full-platform user, regardless of which New Relic Edition you pick. You get one full platform user with the Standard Edition, then $99 per user after. You can add up to five users with a Standard Edition.
Both New Relic and Better Stack platforms offer essential monitoring functionalities, but New Relic focuses on application-centric monitoring, while Better Stack covers a broader spectrum of infrastructure and application monitoring, including logs and alerting.
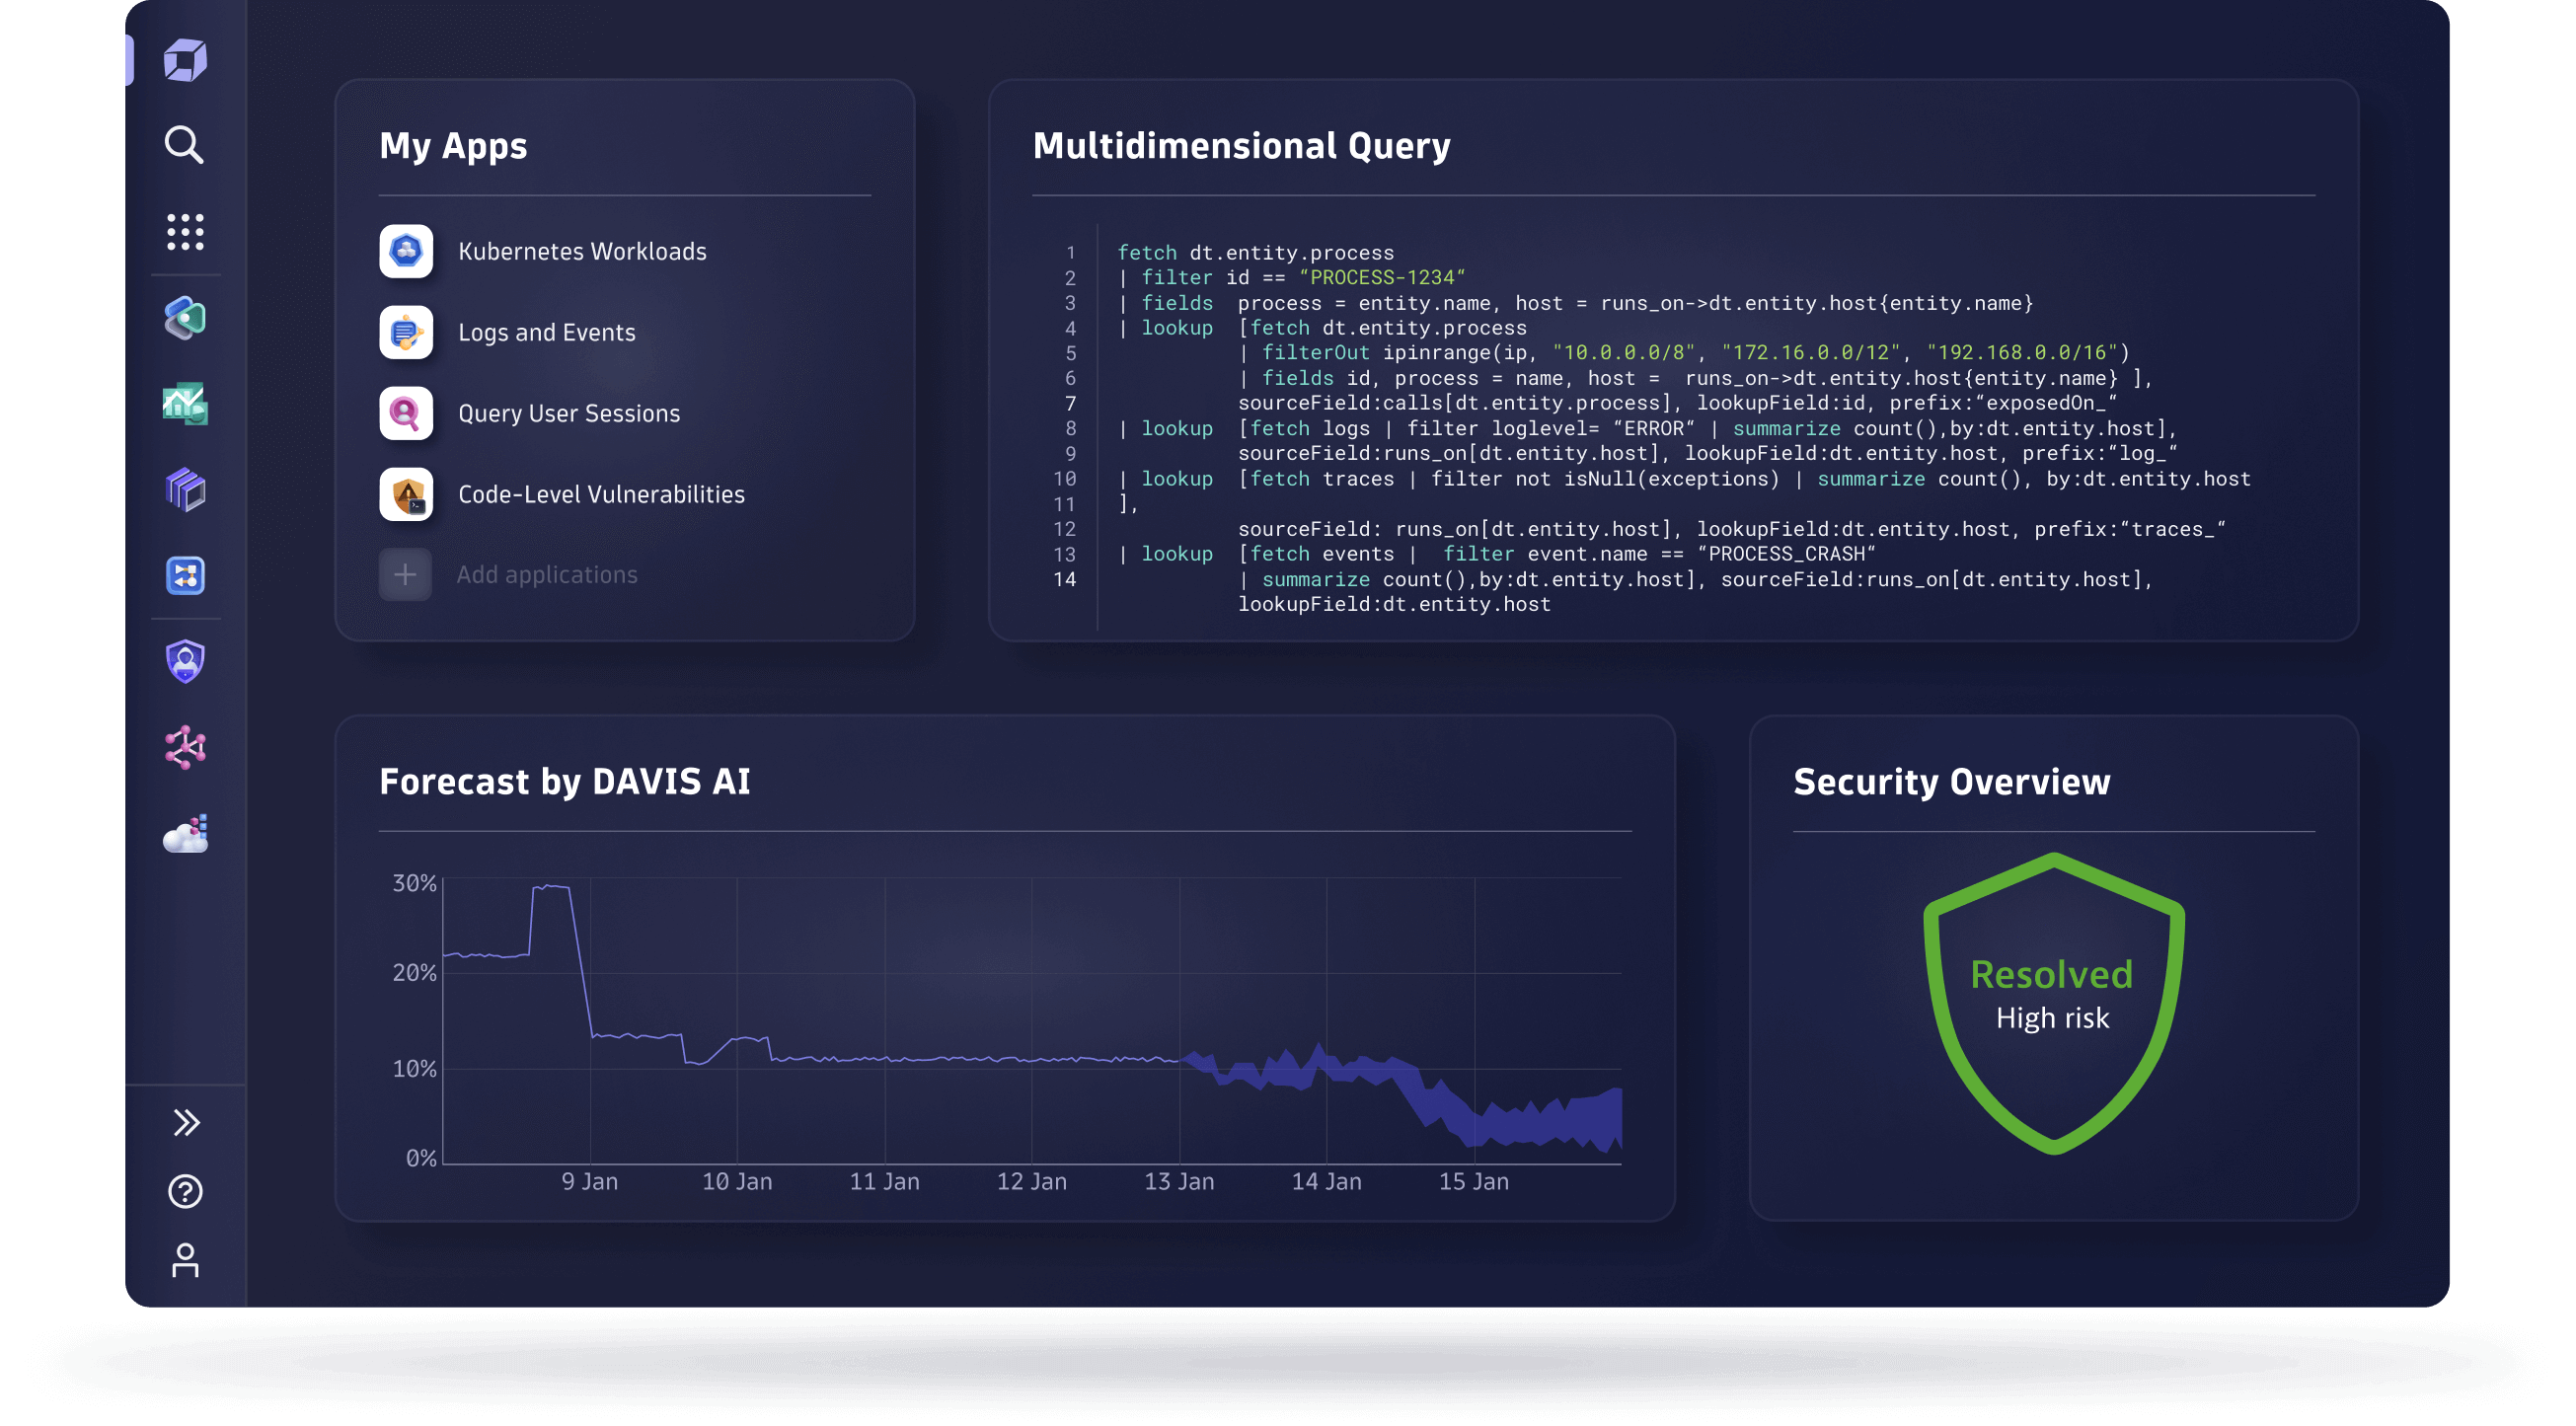
Dynatrace
Dynatrace offers two distinct products, namely Log monitoring v1 and Log monitoring v2 modes, each presenting unique approaches to log management. The v2 mode, characterized as more recent by Dynatrace, addresses issues related to logs with unrecognized timestamps and introduces a versatile log data ingestion engine. However, despite these advancements, certain features, including sensitive information masking, UI configuration files on a host, and on-demand access to log files on the monitored host, remain absent in the v2 version. It’s important to note that both versions have their strengths and limitations, and users must weigh the trade-offs based on their specific requirements.
Pros
- V1 and V2 log monitoring
- Ability to create custom synthetic monitoring workflows
- Metrics addition to the UI
- AI-driven analytics
- Monthly reports for application performance and SLAs
- Custom workflow creation
Cons
- UI can be more user-friendly
- The alerting mechanism should be improved for a smoother experience
- Lack of clear documentation and complexity
- The concept is rather intricate, making it challenging to grasp, and there’s a risk that it could become more overwhelming than beneficial for a non-technical person
- Higher pricing
- Sometimes takes a long time to identify and analyze processes
- The alert notification system fails to ascertain the urgency of an issue and whether it requires immediate attention or not.
Pricing
- Full-Stack Monitoring – $0.08
- Infrastructure Monitoring – $0.04
- Application Security – $0.18
- Application Security – $0.00225
- Synthetic Monitoring – $0.001
- Log Management & Analytics – $0.20
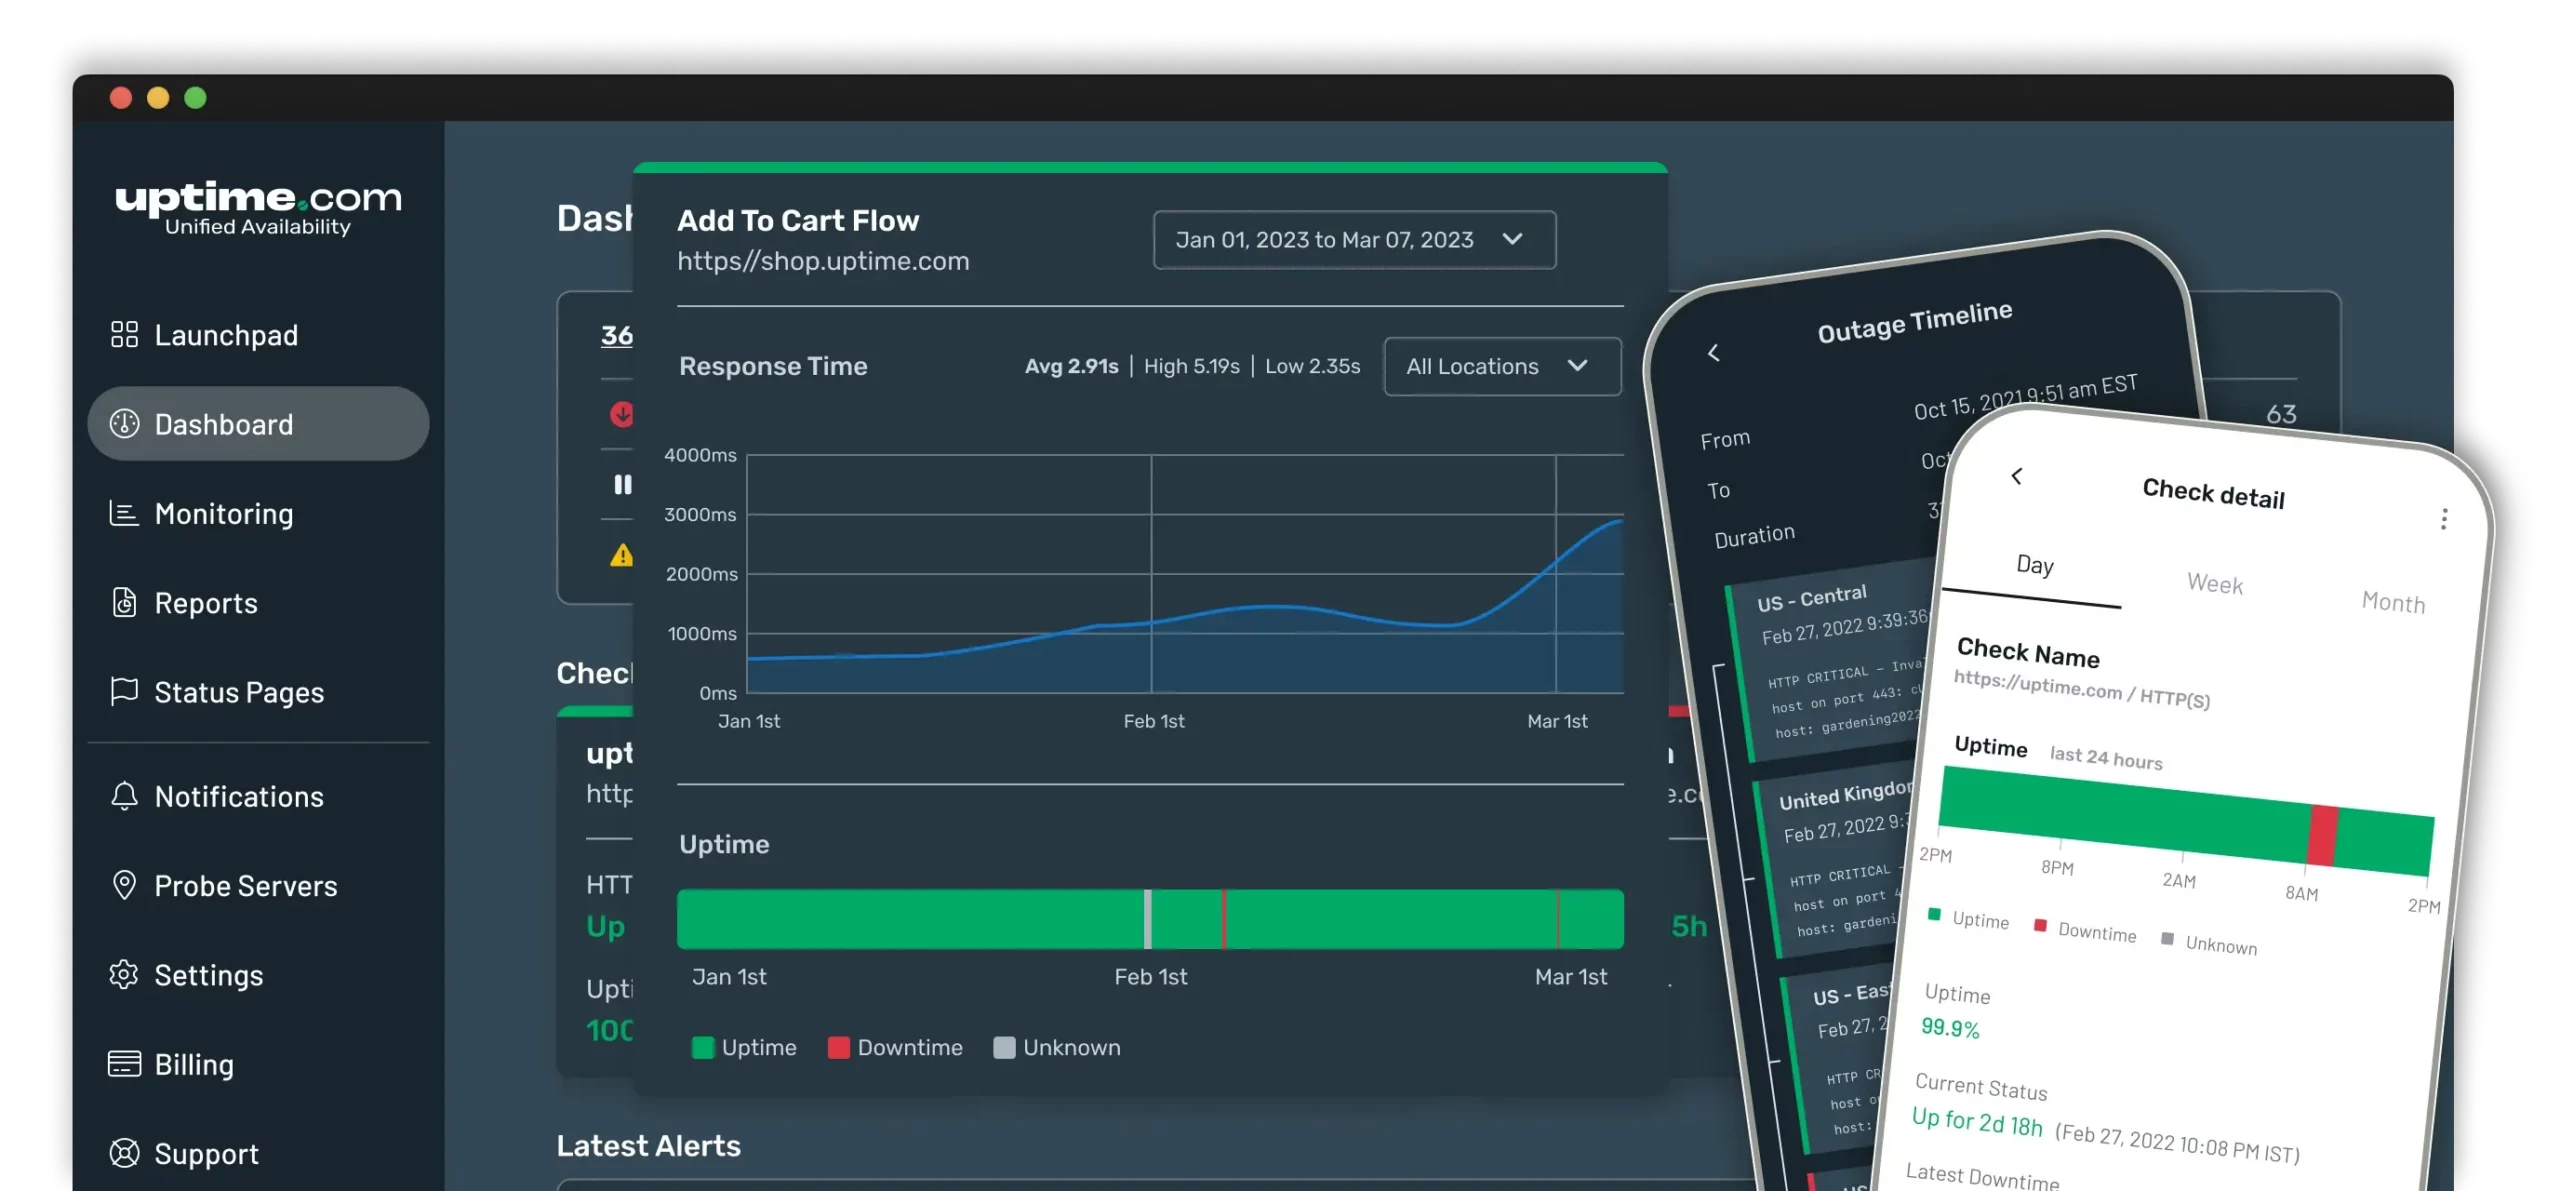
Uptime.com
Uptime.com doesn’t offer any free package. It provides unmatched visibility and availability, empowering engineering, operations, and SRE teams to monitor & respond to their most essential services.
The Starter plan starts at $20 per month which includes 20 basic checks, no status page, and groups that are not included in this package. While Uptime.com’s pricing structure may position it as a relatively expensive alternative. It’s essential to recognize the company’s established reputation and consider whether the pricing aligns with the perceived reliability of its systems.
Pros
- Notifies quickly of any detected issues
- Robust API
- Multiple monitoring locations
- Easy configuration
- Insight reporting
Cons
- More expensive than other tools
- The timeout limit of 60sec on the transactions was a bit difficult to manage for some users
- Fales notification issue if the monitor is not configured properly
- Public status pages could be more configurable
Pricing
- Starter package – $20/month with 20 checks
- Essential package – $67/month with 40 checks
- Premium package – $379/ month with 200 checks
HetrixTools
HetrixTools is an easy-to-use uptime monitoring and blacklist check tool. With Hetrix tools you can select to monitor your website or server from up to 12 different locations around the world. Each one of your Uptime Monitors will have a neatly organized Uptime Report, which will contain all of its history, such as recorded outages, errors, response time, etc. Every Uptime Report is private by default, which means that only you (as a logged-in user) can view it, but you can also choose to make it public and share it with your colleagues or clients.
Every Uptime Monitor comes with detailed reporting, encompassing its entire history, including recorded outages, errors, response times, and more. By default, each Uptime Report is private, ensuring that only you, as a logged-in user, have access. However, you also have the option to make it public, allowing you to share it with colleagues or clients as needed.
Pros
- Blacklist monitoring
- Customizable alerts and notification
- User-friendly interface
- Reporting
- Pricing
- Geographical monitoring
Cons
- Network problem
- Security issue
- Adaptability
- Customization and flexibility
Pricing
- Professional – $9.95/month
- Business – $19.95/month
- Enterprise – $49.95/month
After conducting thorough research and rigorous testing, UptimeMonster has proven itself as the premier substitute for Better Stack. It encompasses all the vital features essential for smooth project management, presenting a cost-effective solution that is especially advantageous for startups and small teams.