

8 Best LibreNMS Alternative For Your Network Monitoring Needs
![]() 12 Mins Read
12 Mins Read
Are you looking for the LibreNMS Alternative?
LibreNMS stands as a robust network monitoring system, offering users a suite of tools to manage their network across diverse configurations effectively. One of its key features is its automated discovery capability, which facilitates the comprehensive mapping of the entire network through protocols like ARP, SNMP, and CDP. This feature enables users to gain insight into their network topology and device inventory effortlessly.
Moreover, LibreNMS empowers users with customizable alerting functionality. This means that users can set up notifications to be alerted when network performance reaches predefined thresholds. This proactive approach ensures that network administrators stay informed about potential issues or anomalies, allowing for timely intervention and maintenance to uphold network reliability and performance.
Limitations and challenges of LiberNMS
- Complexity of Configuration: Configuring LibreNMS to suit specific network environments can be complex and time-consuming, especially for users with limited experience in network monitoring tools.
- Scalability Issues: While LibreNMS is suitable for small to medium-sized networks, it may face scalability challenges when dealing with larger or more complex infrastructures.
- Resource Intensive: Running LibreNMS requires significant system resources, including CPU, memory, and storage. This can be a limitation for organizations with limited hardware resources or budget constraints.
- Lack of Native Support for Some Devices: LibreNMS may not have native support for certain network devices or vendors, requiring manual configuration or the development of custom device templates.
- Limited Integration Options: Integrating LibreNMS with other monitoring or management tools may be challenging due to limited support for standard protocols or APIs.
- Maintenance Overhead: Regular maintenance and updates are essential to keep LibreNMS running smoothly and securely. This can add to the administrative overhead, particularly for organizations with limited IT resources.
- Performance Monitoring Limitations: While LibreNMS offers basic performance monitoring capabilities, it may lack advanced features or deep insights into network performance metrics compared to specialized monitoring tools.
- Customization Constraints: Although LibreNMS is highly customizable, making extensive modifications or implementing custom features may require advanced programming skills or familiarity with its underlying architecture.
Best LibreNMS Alternative
UptimeMonster
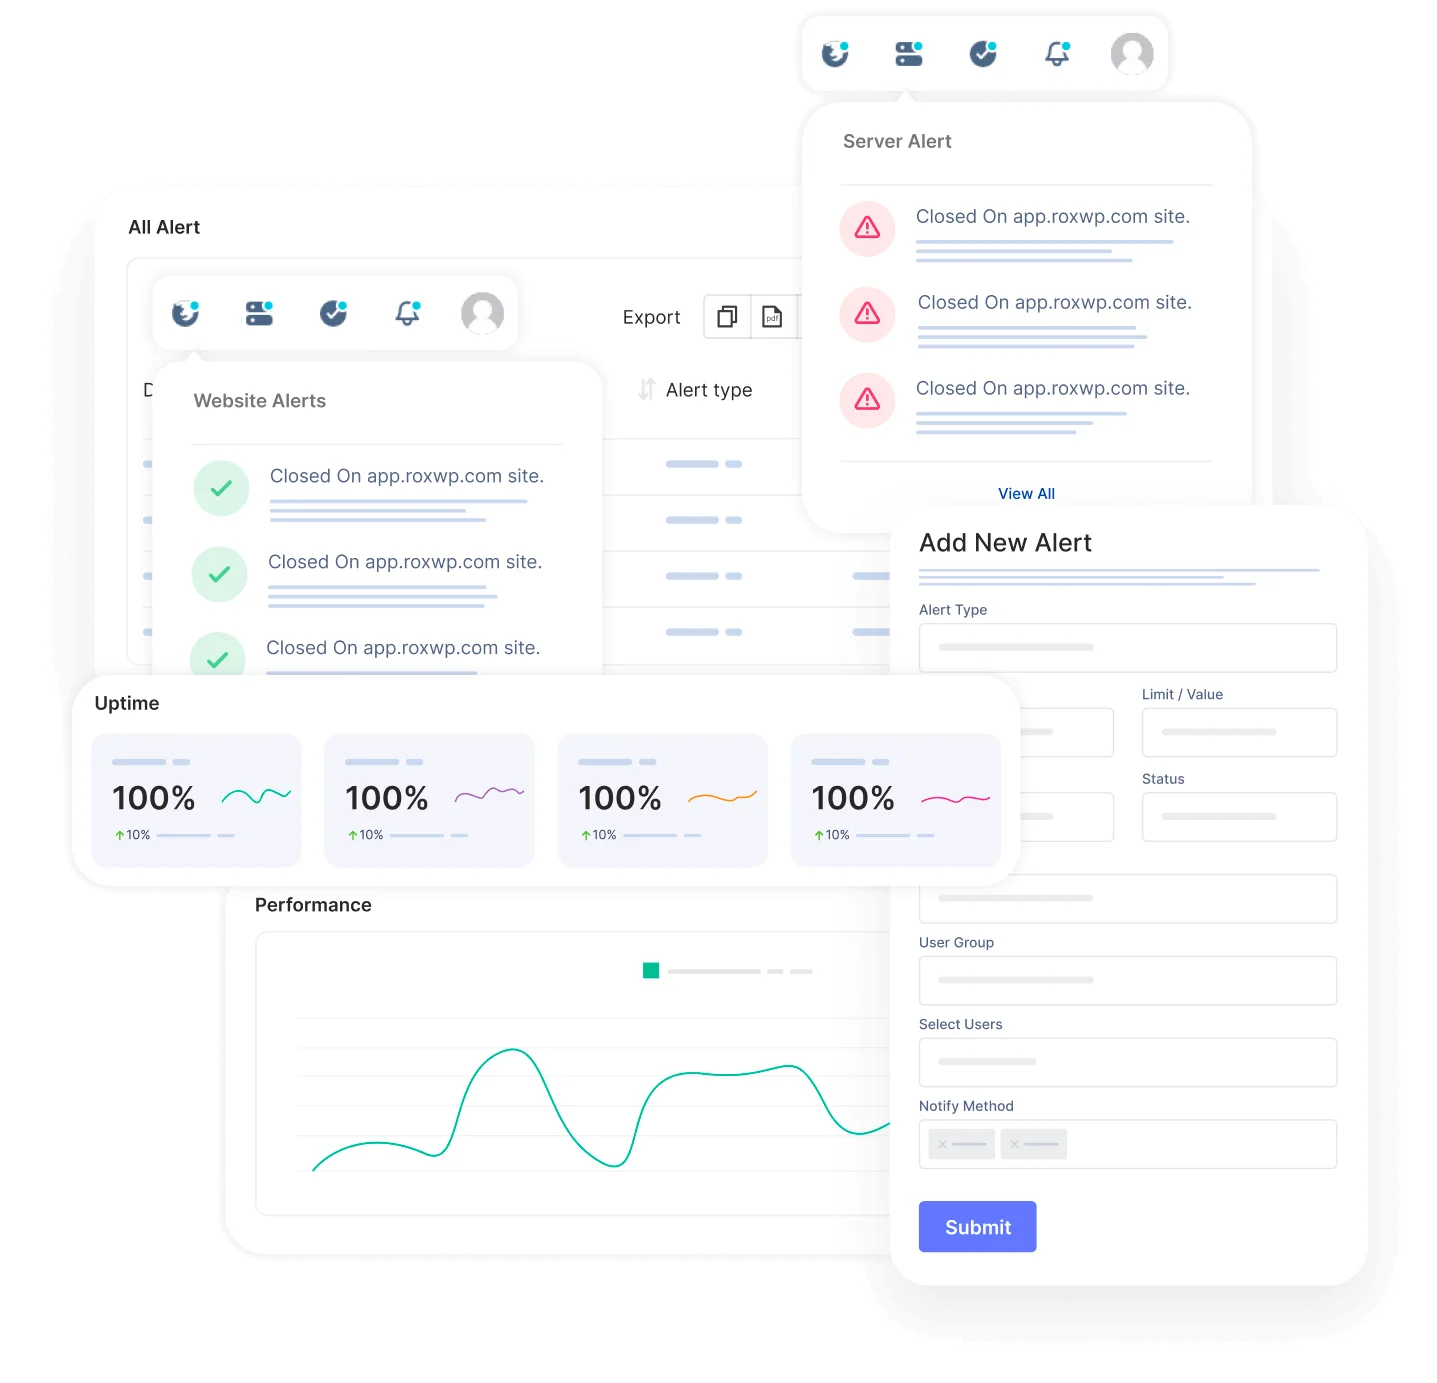
Reliable website and server monitoring service from the cloud to monitor your web availability, performance, and security. The tool will give you a 24/7 website monitoring service that will Monitor the availability of your website, APIs, and business-critical web transactions with powerful synthetic monitoring and testing tools.
It collects, correlates, and monitors servers alongside data from the rest of your stack. UptimeMonster server monitoring allows you to visualize, analyze, and track down different query metrics happening on your server so that you can prevent them before anything goes wrong.
Monitor your network performance like IP, DNS, Service port, Application, and others using the check monitoring tools. It will enable you to understand the network behavior and track NetFlow.
UptimeMonster check monitoring service will give you full control over your network. The check monitoring types are as follows
- TCP (Transmission Control Protocol)
- ICMP PING (Internet Control Message Protocol)
- IP Blacklist
- UDP (User Datagram Protocol)
- DNS (Domain Name Server)
- Application Monitoring
With a status page, you can share your monitoring activities and incidents with customers. You can easily make our status page public or private. You can highly customize your status page and share it with your customers to reduce the number of customer support tickets.
Using the status page you can easily gain trust from your customers. The alert notification easily notifies your customers about any incidents so that they can take necessary steps to prevent the issue. So that they will always be prepared and stay tuned.
Create and customize intricate policies for the escalation of incidents by taking into consideration various factors, including the passage of time, the availability of your team, and the source or origin of the incident.
The primary advantage, however, lies in integrated incident management and alerting. This is particularly advantageous for DevOps teams aiming to streamline their stack and potentially handle everything from a unified platform, eliminating the necessity for additional platforms.
Key Features
- Reliable Website and Server Monitoring
- Network Performance Monitoring
- Check Monitoring Types
- Status Page Customization
- Alert Notifications
- Incident Escalation Policies
- Incident Timeline
- SSL Expiration Monitoring
- Search String Monitoring
- Monitoring for HTTP(s), Ping, Port, DNS, SSL & TLD expiration, Cron jobs
- Unlimited email and push notification alerts
- Capture screenshots & error logs for incidents
Pros
- Reliable Uptime Monitoring
- Easy Setup and Configuration:
- Cost-Efficiency
- Customer Support:
- Accurate Reporting:
- User-Friendly Interface
- Customizable Alerts
- Status Page
- Escalation policies
- Incident Timeline Report
Cons
According to user reviews, UptimeMonster doesn’t exhibit any notable drawbacks. However, a few users have highlighted certain feature limitations present in the free plan offering. These limitations might include restricted access to certain functionalities or reduced capabilities compared to the premium plans. Despite this, the overall consensus from users is overwhelmingly positive regarding the platform’s performance and functionality.
Our perspective on this matter revolves around the notion that smaller teams might not necessitate the utilization of numerous advanced features. Therefore, it appears reasonable to curtail access to certain functionalities, considering that smaller teams might not require or fully utilize these advanced features. This approach ensures a streamlined and more focused user experience, optimizing the platform’s usability for smaller teams with specific needs.
Pricing
- Standard plan at $7/month with 30 monitors and 2-minute interval
- Professional plan at $19/month with 50 monitors and 1-minute interval
- Business plan at $99/month with 100 monitors and 25-second interval
Munin
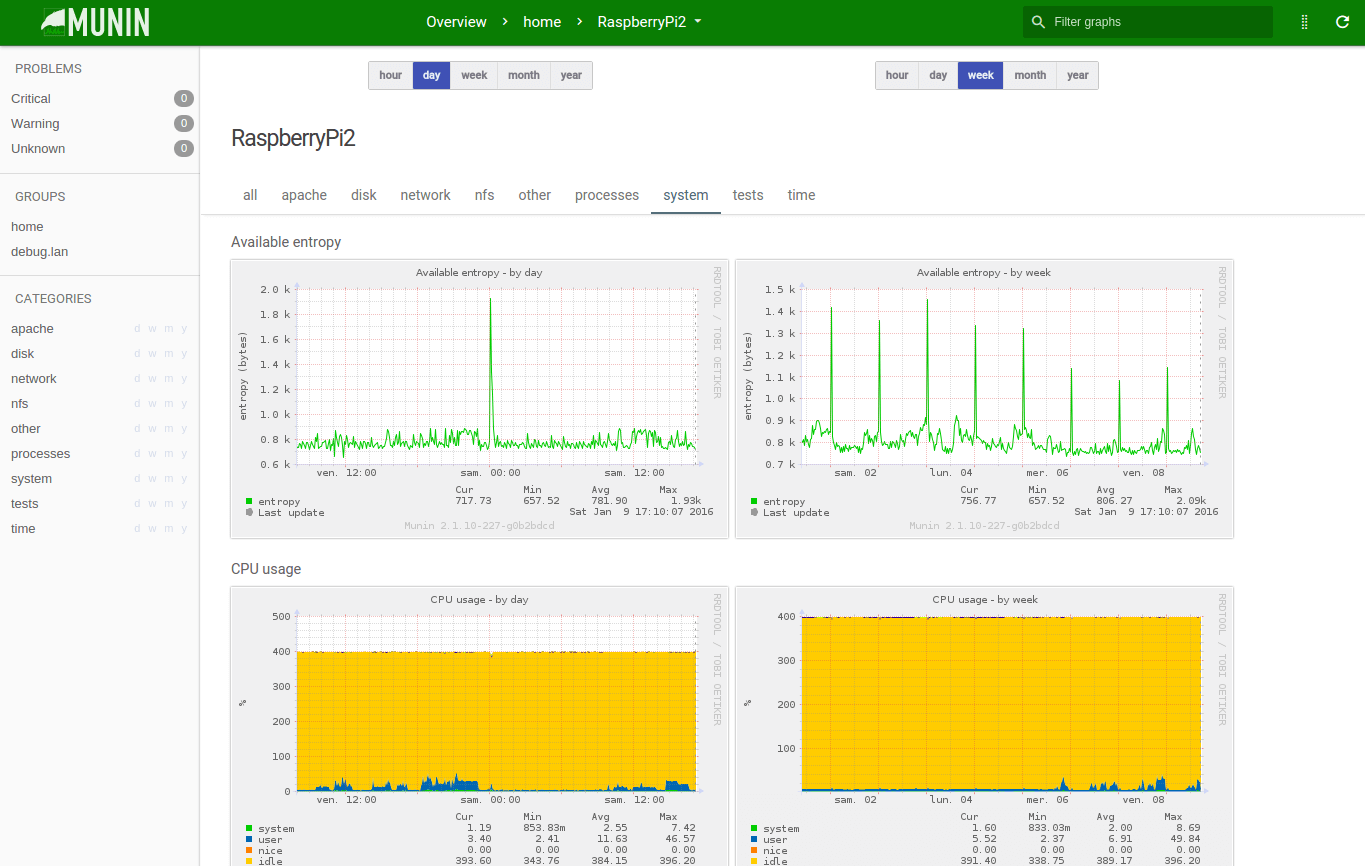
Munin stands as an open-source software solution designed to facilitate comprehensive monitoring of system, network, and infrastructure components. Its functionality proves invaluable for system administrators, offering real-time insights into critical aspects of their networks. As a foundational tool, Munin lays the groundwork for various other open-source solutions like Nagios or MRTG, which are commonly employed in enterprise management scenarios.
One of Munin’s key strengths lies in its modular and componentized architecture, allowing for unparalleled flexibility across diverse environments. Whether deployed on embedded systems at the host level or as part of comprehensive monitoring suites spanning an entire enterprise’s server and network infrastructure, Munin adapts seamlessly to meet the unique monitoring needs of each scenario.
At its core, Munin leverages the capabilities of RRDTool, utilizing a MySQL database and specially tailored packages for platforms like Debian to store and manage monitoring data effectively. Moreover, Munin offers specialized features for cloud monitoring and automation solutions, particularly for Microsoft Azure environments.
Key Features
- Easy to install
- Real-time alerts. Munin polls your servers once every 5 minutes
- Scalable. Monitor all-scales installations, from your home Raspberry Pi up to a 100+ nodes cluster
- Flexible
- Extensible
- Maintained
Pros
- Open-Source
- Comprehensive Monitoring
- Modular Architecture
- Integration with RRDTool
- Easy Setup and Configuration
- Community Support
Cons
- Munin’s alerting capabilities may be limited compared to more advanced monitoring solutions, making it less suitable for environments requiring robust alerting and notification functionalities.
- While Munin provides visually appealing graphs and charts for data visualization, its graphical interface may lack some advanced features found in other monitoring tools.
- While Munin is relatively easy to set up and configure for basic monitoring needs, configuring it for more advanced use cases or custom requirements may require additional expertise and effort.
- Munin relies heavily on RRDTool for data storage and visualization, which may limit flexibility and integration options compared to solutions with more diverse backend support.
- While Munin is a mature project, its development may be slower compared to newer monitoring solutions, resulting in potential delays in feature updates and improvements.
Cacti
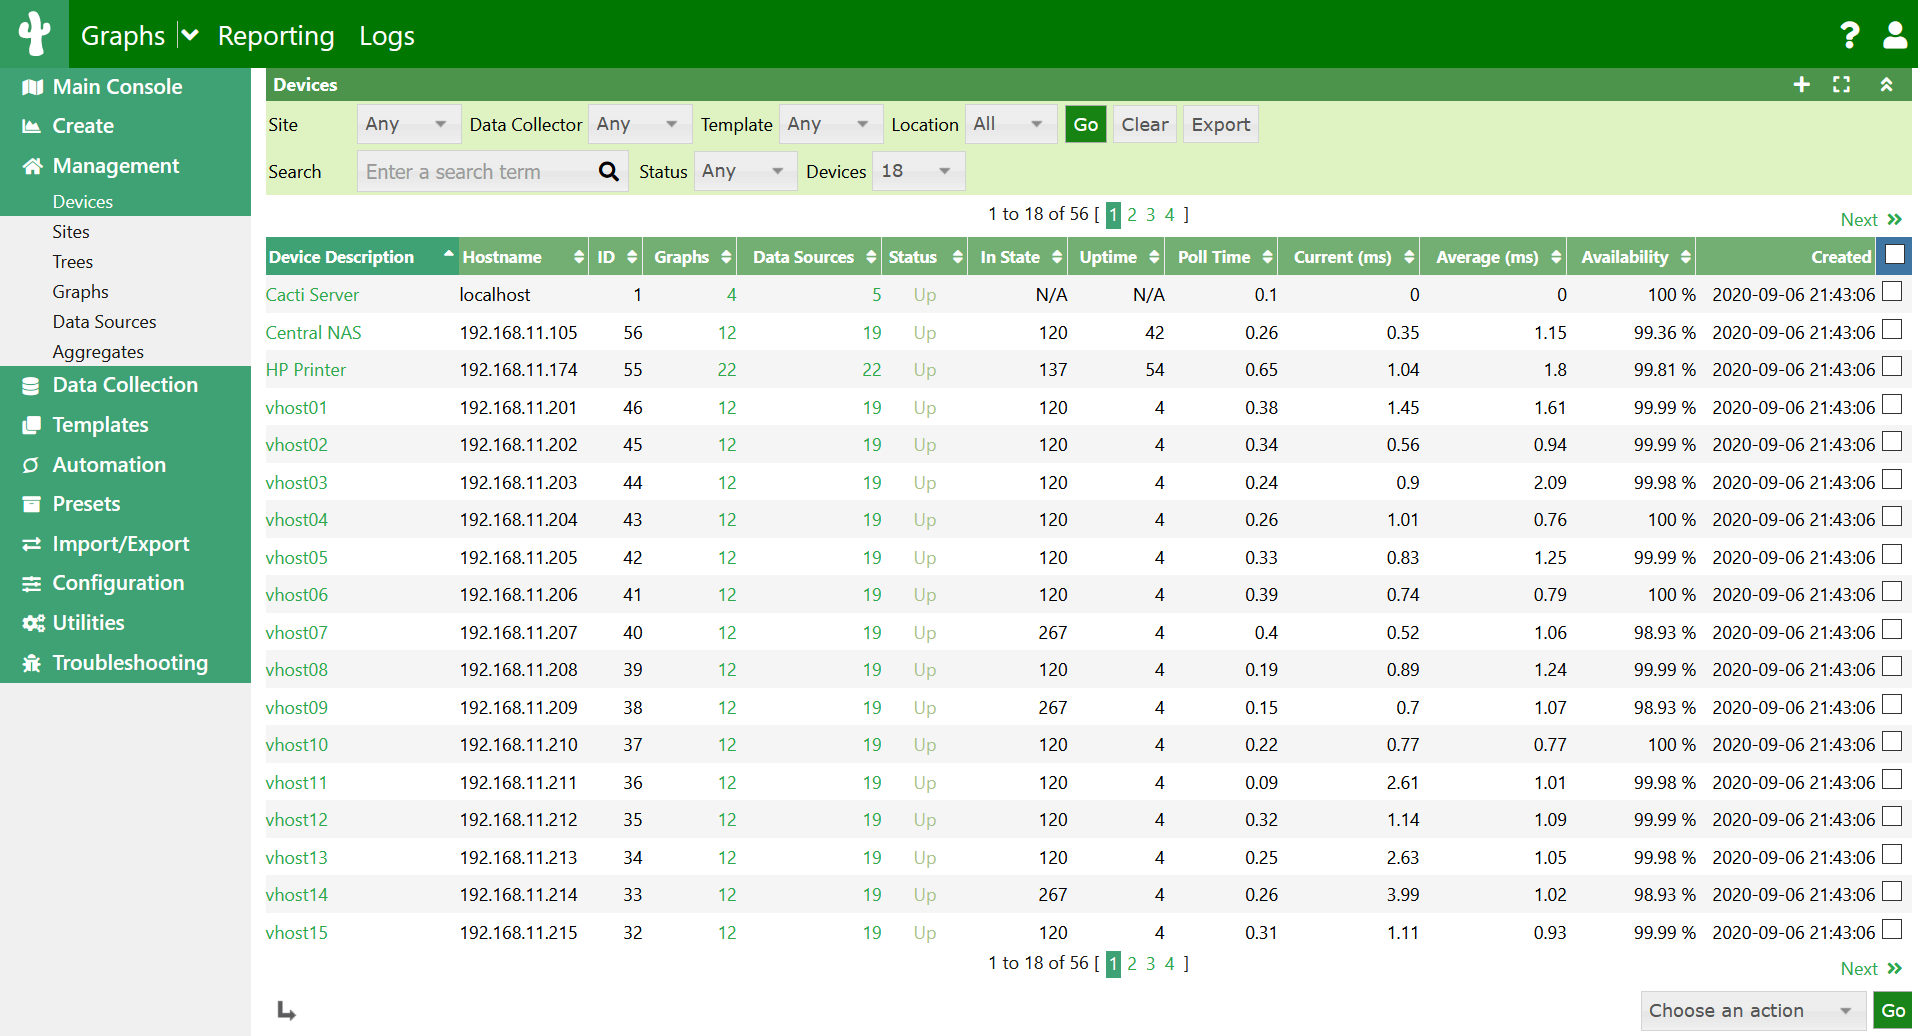
Cacti stands as a dependable network monitoring and graphing solution, leveraging RTD (Round Trip Delay) technology to deliver robust data storage and visualization capabilities alongside comprehensive network monitoring functionalities. The platform features a swift poller, empowering users with rapid data collection, and powerful graph templating tools, facilitating the creation of visually appealing representations of network performance metrics.
Moreover, Cacti offers mobile data collection techniques, allowing users to gather monitoring data from remote or mobile devices seamlessly. Its user administration capabilities come pre-configured, enabling straightforward management of user access and permissions straight out of the box.
With a user-friendly interface, Cacti provides easy access to its wide array of features, making it suitable for networks of varying sizes – from smaller LAN setups to extensive networks with numerous devices. Its scalability and flexibility ensure that it can adapt to the evolving needs of network administrators and IT teams, offering valuable insights into network performance and facilitating proactive management and troubleshooting.
Key Features
- Devices / Device Templates
- Graphs / Aggregates / Graph Templates
- Data Sources / Templates / Profiles
- Data Collection / Polling
- Templating and Packaging
- Discovery and Automation
- Graph Viewing Options
Pros
- Robust Graphing
- Flexible Templates
- Fast Polling
- Mobile Data Collection
- User Administration
- Scalability
Cons
- Setting up Cacti can be complex, especially for users with limited experience in network monitoring tools, requiring time and effort for configuration.
- Cacti’s alerting capabilities may be limited compared to more advanced monitoring solutions, making it less suitable for environments requiring robust alerting and notification functionalities.
- While Cacti’s graph templating feature offers flexibility, users may find themselves dependent on templates for customization, which could limit adaptability to unique monitoring requirements.
- Running Cacti may require significant system resources, particularly in environments with large-scale monitoring deployments, potentially impacting system performance.
- While Cacti provides access to a wide array of features through its interface, the complexity of the interface may pose challenges for novice users, requiring familiarization and training.
- Cacti’s development pace may be slower compared to newer monitoring solutions, resulting in potential delays in feature updates and improvements.
GlassWire
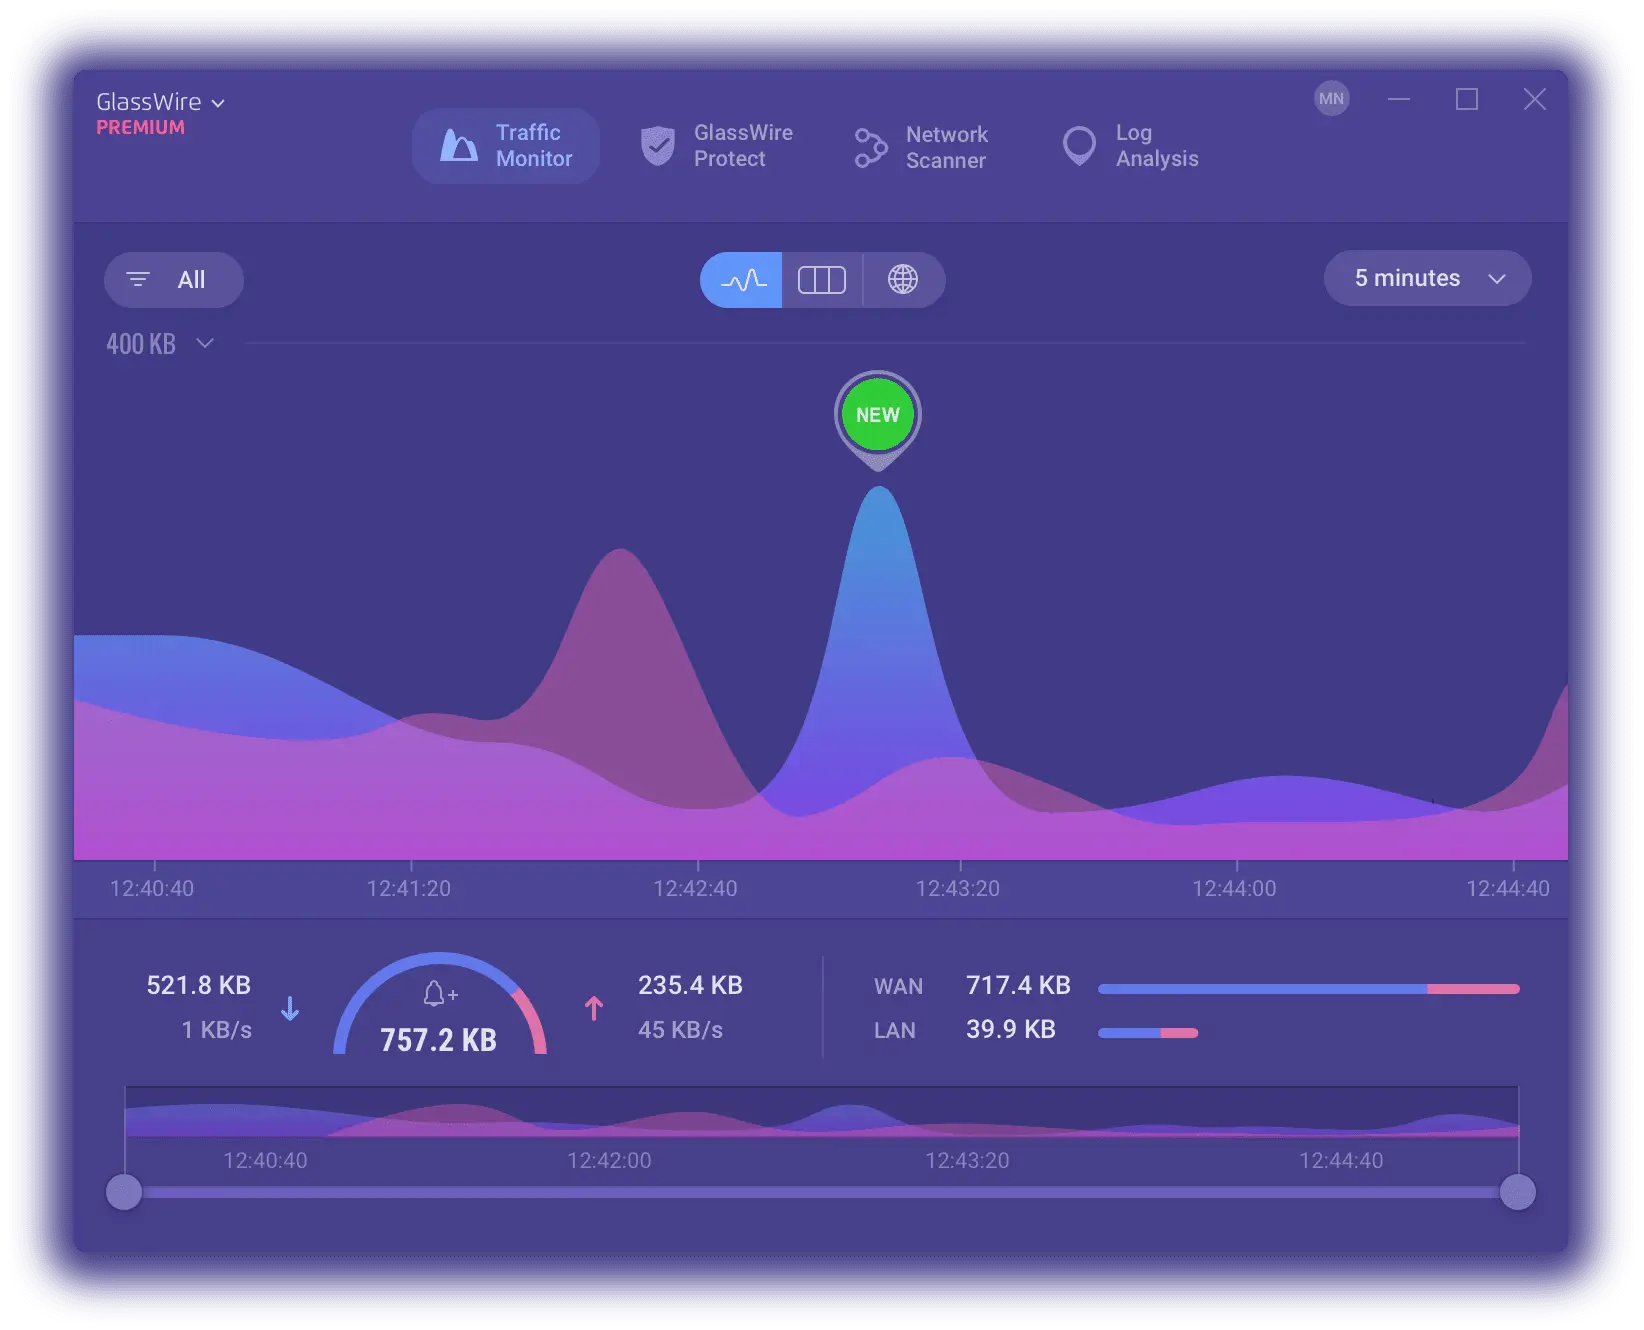
GlassWire provides a unique firewall system that is notably absent from most leading antivirus programs. However, it’s essential to differentiate between a traditional firewall focused solely on external system protection and GlassWire’s comprehensive networking and threat monitoring capabilities.
In addition to firewall protection, GlassWire offers a range of supplementary services to its users, such as advanced network monitoring and threat detection functionalities. This broader feature set enhances users’ ability to monitor and protect their network environment effectively, providing valuable insights into network activity and potential security threats.
Key Features
- Visual Network Monitoring
- Internet Security
- Anomaly Detection
- Management Console
- Multiple Server Monitoring
- Bandwidth Usage Monitor
Pros
- User-Friendly Interface
- Comprehensive Network Monitoring
- Firewall Protection
- Threat Detection
- Bandwidth Usage Monitoring
- Customizable Alerts
Cons
- While GlassWire offers a free version with basic features, some advanced functionalities such as remote monitoring and longer data history storage are only available in the paid versions.
- GlassWire can consume significant system resources, especially when running continuous network monitoring or firewall protection, which may impact system performance.
- The extensive features and capabilities of GlassWire may be overwhelming for novice users, requiring time and effort to fully understand and utilize the software effectively.
- Compatibility Issues: GlassWire may encounter compatibility issues with certain antivirus or security software, potentially leading to conflicts or performance issues.
PagerDuty
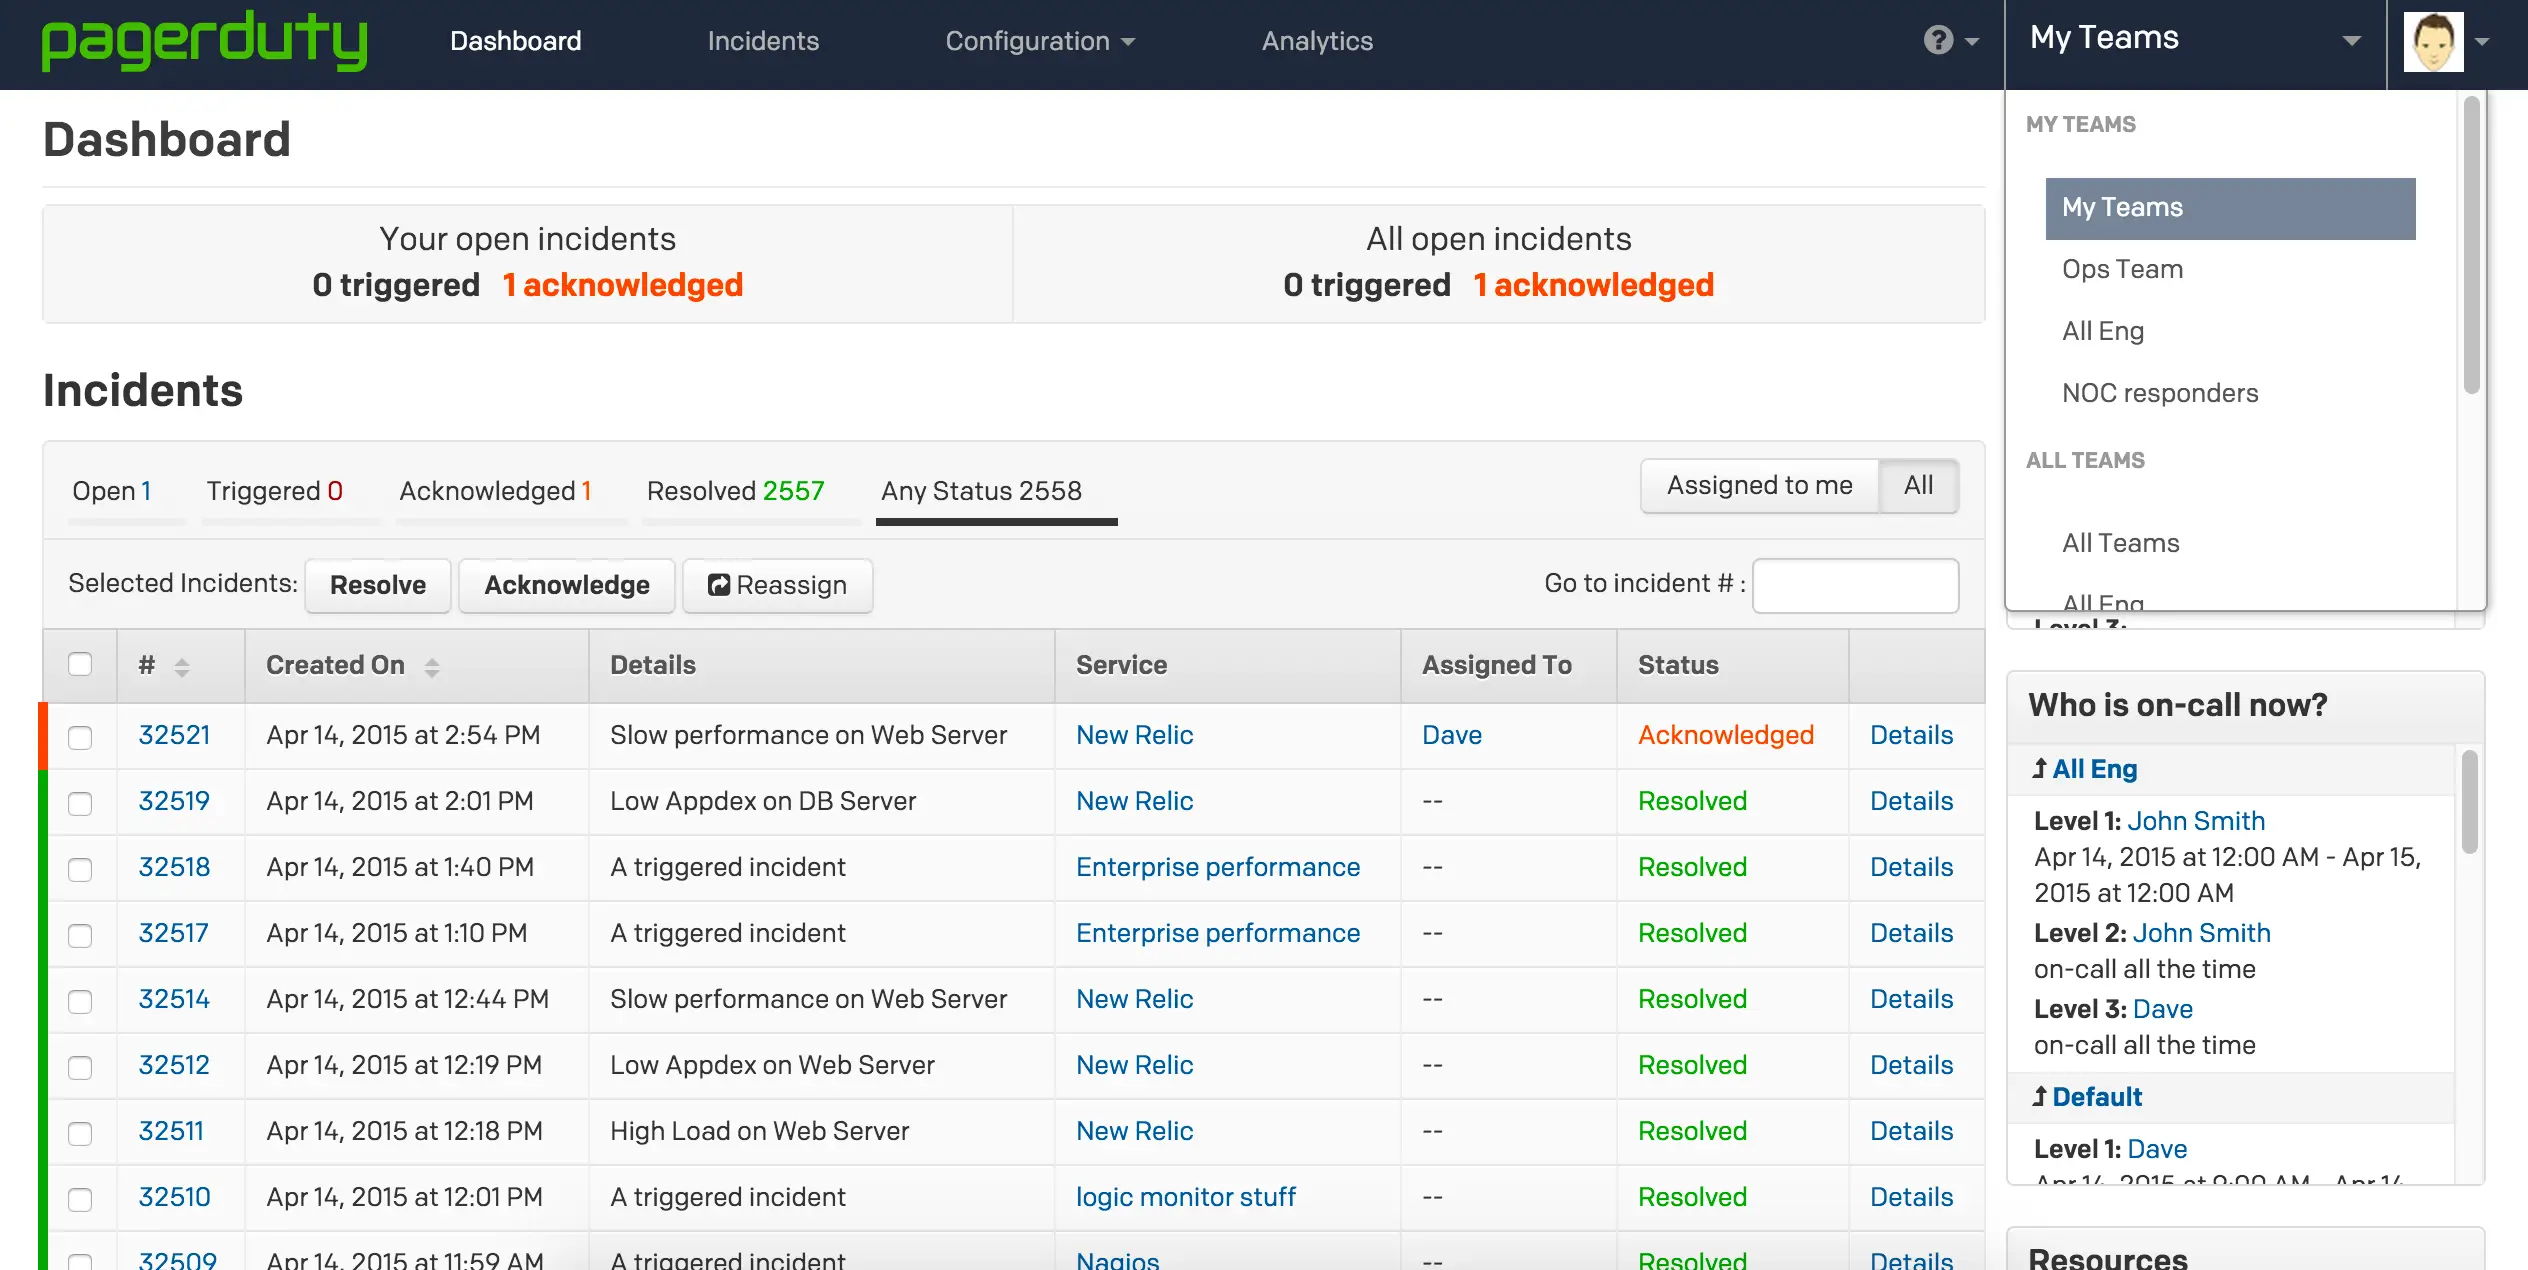
PagerDuty empowers proactive management of digital operations by gathering data signals from various sources, utilizing machine learning to interpret these signals, automatically involving the appropriate individuals, and expediting resolution and learning processes. It enables teams to detect, triage, and resolve incidents in real-time, minimizing downtime and improving operational efficiency. By centralizing incident communication and response workflows, It empowers teams to collaborate seamlessly and maintain business continuity even in the face of unexpected disruptions.
Key Features
- It offers robust alerting capabilities, allowing teams to receive timely notifications via multiple channels, including SMS, email, phone calls, and mobile push notifications.
- With customizable escalation policies, PagerDuty ensures that incidents are automatically routed to the right team members based on predefined escalation rules, ensuring swift response and resolution.
- It simplifies on-call scheduling by providing an intuitive interface for managing on-call rotations, schedules, and overrides, ensuring that the right person is always available to respond to incidents.
- PagerDuty’s incident management tools facilitate the triage and resolution of incidents by providing centralized incident timelines, collaboration tools, and status updates, enabling teams to work together efficiently to resolve issues
Pros
- Reliable Incident Alerting
- Customizable Escalation Policies
- Robust Integrations
- Comprehensive Incident Management
Cons
- Its extensive feature set and customization options may be overwhelming for new users, requiring time and training to fully understand and utilize the platform effectively.
- Its pricing plans can be expensive, especially for smaller organizations or teams with limited budgets, potentially making it less accessible to some users.
- While PagerDuty offers robust integration capabilities, configuring and managing integrations with external tools and systems may require technical expertise and administrative overhead.
- Mastering advanced features and best practices may require a significant learning curve for users who are new to incident management platforms.
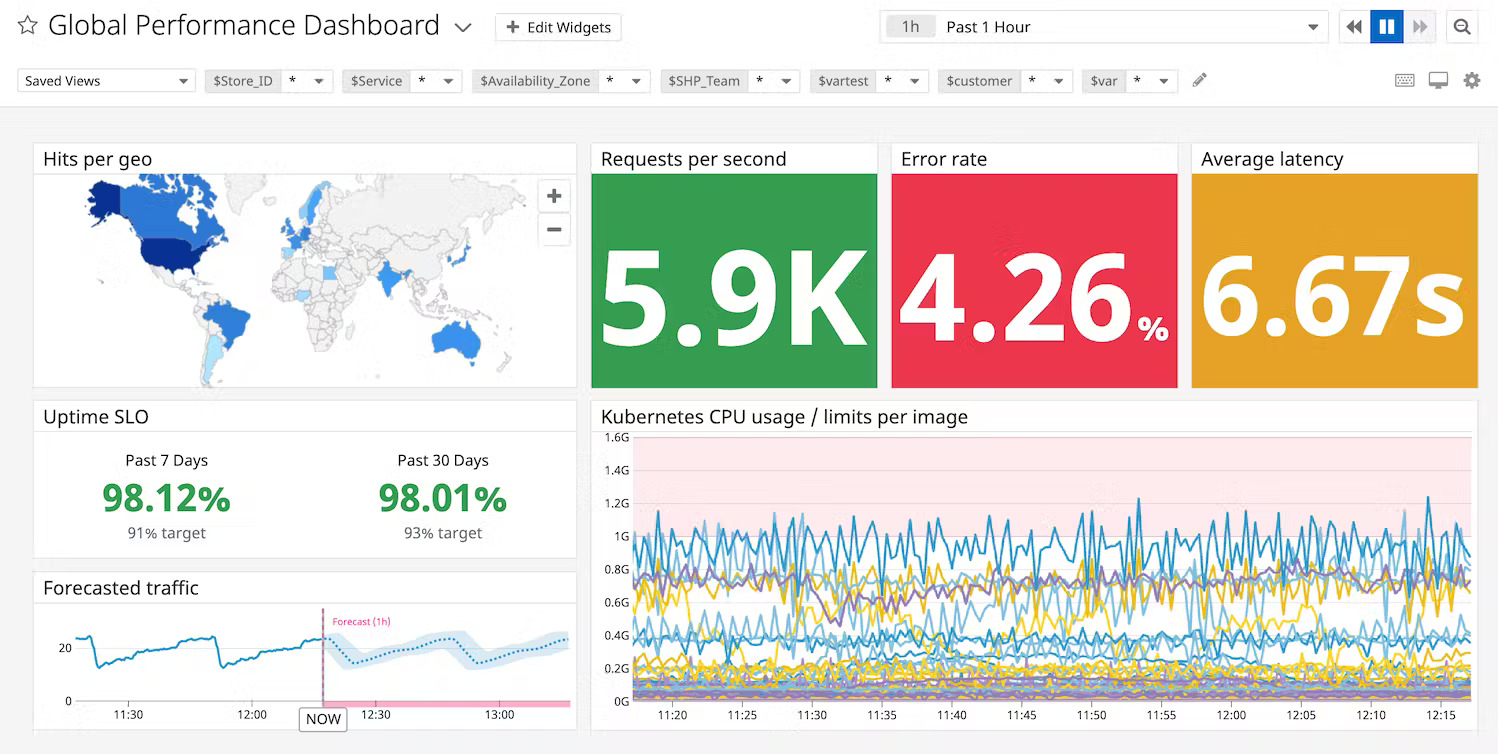
DataDog
Datadog’s website monitoring stands out as a comprehensive solution that offers unparalleled visibility. It goes beyond mere aggregation by seamlessly collecting metrics and events from an extensive range of over 500 integrated technologies, tagging and storing them for further analysis.
Notably, Datadog streamlines the entire process by taking care of the ingestion, normalization, and enrichment of logs, allowing users to focus on deriving meaningful insights rather than grappling with technical intricacies. This ensures a user-friendly experience and maximizes the efficiency of log management operations.
Furthermore, Datadog doesn’t stop at threat identification; it actively tracks the performance impact of every deployed code. This automated tracking extends to mapping data flows and dependencies through a service map, offering a visual representation of the intricate relationships within the infrastructure. By doing so, Datadog not only ensures robust security but also provides valuable insights into the operational dynamics of the entire system.
Pros
- Real-time log tracking
- Security monitoring
- Integrations
- Alerting system
- Custom downtime for deployment
Cons
- The primary weakness of Datadog lies in its scaling capabilities. Increasing metrics monitoring necessitates additional monitors, significantly impacting monthly billing and leading to high expenses.
- Datadog’s complexity might pose challenges, particularly for users unfamiliar with monitoring systems. Navigating and finding specific functionalities can be challenging without prior experience.
- Immediate action is lacking when decommissioning a host. It takes up to 24 hours for a host to be officially removed from the list, causing delays in real-time updates upon decommissioning.
- The basic plugins in Datadog offer limited information. Users often need to configure their plugins to obtain more detailed reports, adding complexity to data retrieval.
- Graphical reports in Datadog are not intuitively comprehensive, failing to provide easily understandable and valuable information to users.
Pricing
- Pro package at $15 per host/per month
- Enterprise package at $23 per host/per month
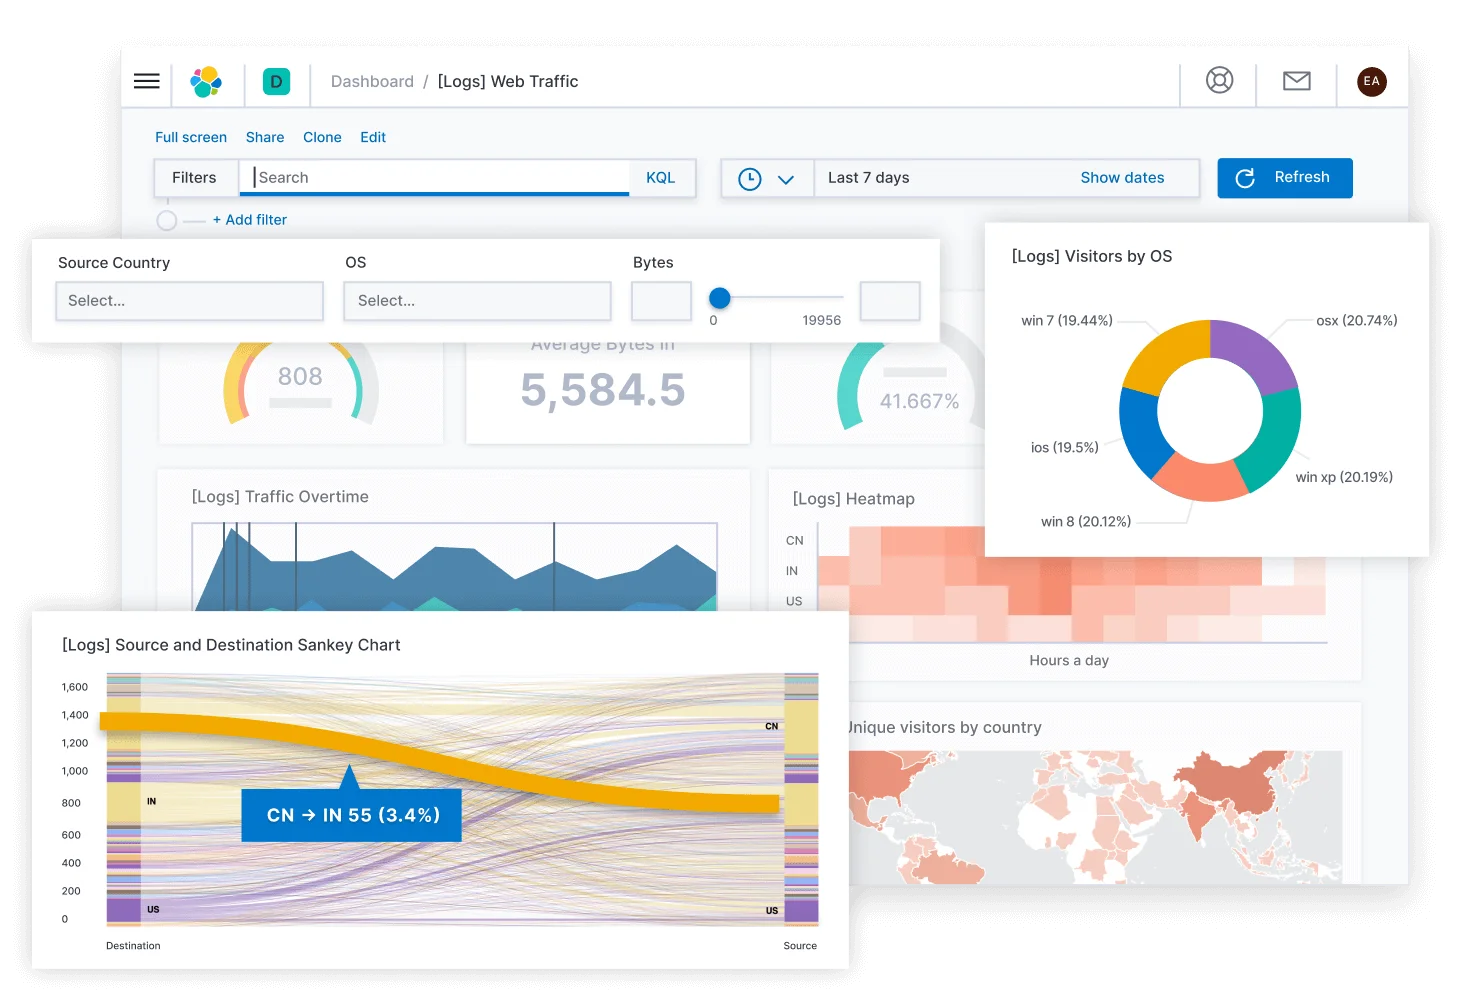
Elastic Stack
Elastic Stack, formerly known as ELK Stack, is a powerful collection of open-source tools designed for searching, analyzing, and visualizing large volumes of data in real time. Comprised of several components, each with its unique functionality, Elastic Stack provides a comprehensive solution for various data management and analysis tasks.
At the core of Elastic Stack is Elasticsearch, a distributed search and analytics engine. It stores and indexes data in near real-time, enabling fast and efficient searching across massive datasets. Elasticsearch is highly scalable, fault-tolerant, and supports complex querying capabilities.
Logstash is a versatile data processing pipeline that ingests, transforms, and enriches data from multiple sources before indexing it into Elasticsearch. It supports a wide range of input sources, including logs, metrics, and event streams, and offers extensive filtering and parsing capabilities.
Key Features
- Open-source and cost-effective: The core functionality is free to use, making it budget-friendly for various needs.
- Scalable and flexible: Adapts to accommodate growing data volumes and diverse use cases.
- Real-time insights: Gain instant visibility into your data, enabling proactive decision-making.
- Powerful search and analysis: Explore and analyze data with precision using Elasticsearch’s robust capabilities.
- Stunning visualizations: Kibana empowers you to create impactful dashboards and reports for clear communication.
- Active community and support: Benefit from a vibrant community offering resources and assistance.
Pros
- Scalability
- Real-Time Data Processing
- Versatility
- Open-Source
- Comprehensive Toolset
Cons
- Complexity
- Resource Intensive
- Learning Curve
- Maintenance Overhead
- Documentation Gaps
- Licensing Considerations
Pricing
- Standard package starts at $95/month
- Gold package starts at $109/month
- Platinum package starts at $125/month
- Enterprise package starts at $175/month
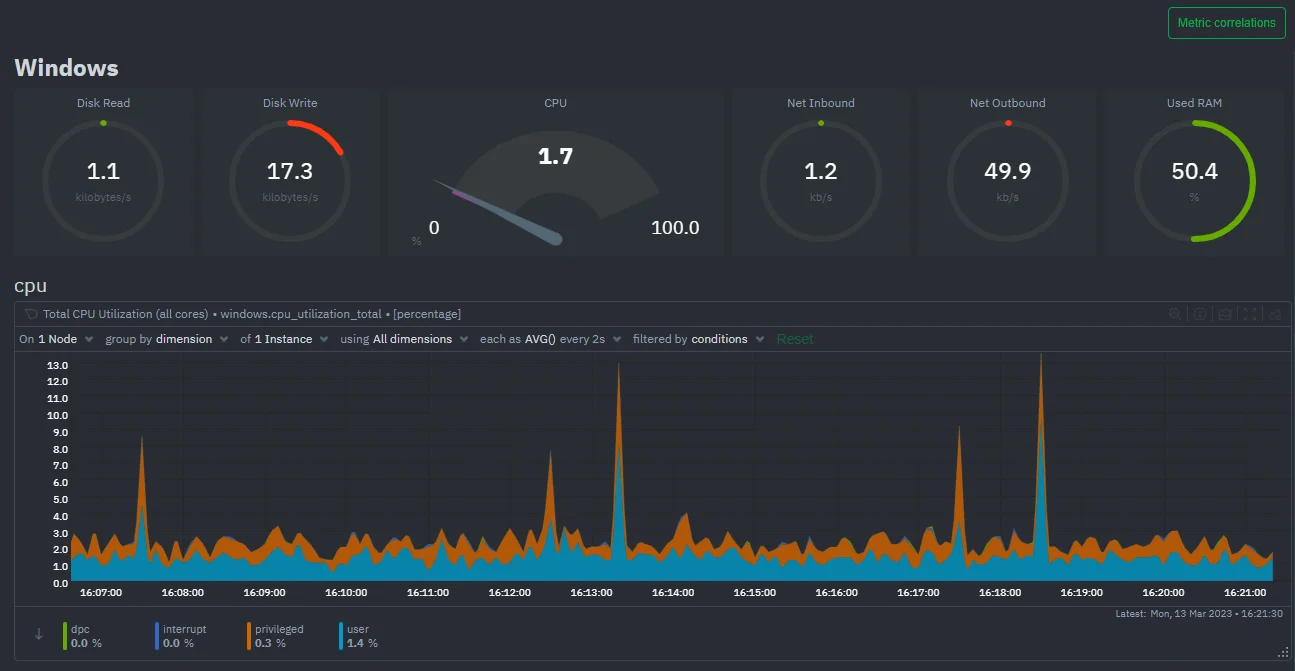
Netdata
Netdata collects metrics every second and displays them in visually appealing, low-latency dashboards. It is crafted to operate seamlessly across your physical and virtual servers, cloud setups, Kubernetes clusters, as well as edge/IoT devices. This allows comprehensive monitoring of your systems, containers, and applications.
Its design incorporates infinite scalability, offering a flexible and highly modular solution. With a user-friendly interface, it is immediately available for troubleshooting without the need for prior knowledge or preparation. Moreover, Netdata seamlessly integrates into existing monitoring toolchains, supporting compatibility with popular solutions like Prometheus, Grafana, Graphite, OpenTSDB, InfluxDB, and others.
Key Features
- Website Monitoring
- No Coding Required
- Real-time Collaboration
- Lightweight
- No Registration Required
- Dark Mode
- Works Offline
- No Tracking
Pros
- Real-time insights
- Easy to use
- Customizable
- Open-source
- Lightweight and resource-efficient
- Active community
Cons
- Setup/configuration is very hard for the beginner
- limited reporting/analytics functionalities
- The UI may seem complex for some users.
- Custom alert configuration is complicated
- Expensive
Wrapping Up
Selecting the best alternative to LiberNMS needs a careful evaluation of your specific needs and how they align with the offerings of various monitoring solutions.
Following exhaustive research and meticulous testing, UptimeMonster has emerged as the top contender to replace Splunk. It encompasses all essential features crucial for seamless project management, offering a cost-effective solution particularly beneficial for startups and small teams.