

Top 10 New Relic Alternative in 2024
![]() 14 Mins Read
14 Mins Read
Are you looking for the best New Relic Alternative for 2024?
New Relic’s platform is designed to help organizations gain insights into their software’s performance, user experience, and overall health. With New Relic, you can get a real-time, comprehensive understanding of your network, infrastructure, applications, end-user experience, machine learning models, and beyond. You can also attain total application visibility, spanning from backend APIs to frontend devices. Whether on-premises or in the cloud, access in-depth visibility into your infrastructure within a unified platform. New Relic also offers effortless management and analysis of logs, enhancing your overall system monitoring capabilities.
Limitations and Challenges of New Relic
- New Relic’s pricing structure may pose a challenge for smaller businesses or startups with tight budgets. Users should carefully consider their monitoring needs and evaluate the cost-effectiveness of New Relic’s offerings.
- Free plans or lower-tier subscriptions may have limitations on the retention of historical data
- Continuous monitoring of applications and infrastructure can introduce some overhead, potentially affecting the performance of the monitored systems.
- Hard to use & help resources are slim
- PHP error logging misses the first line of stack traces
- No Longer data history
- Complex interface
- Alert configuration is complex
- Create False Alarms if the alert is not configured properly
Best New Relic Alternative
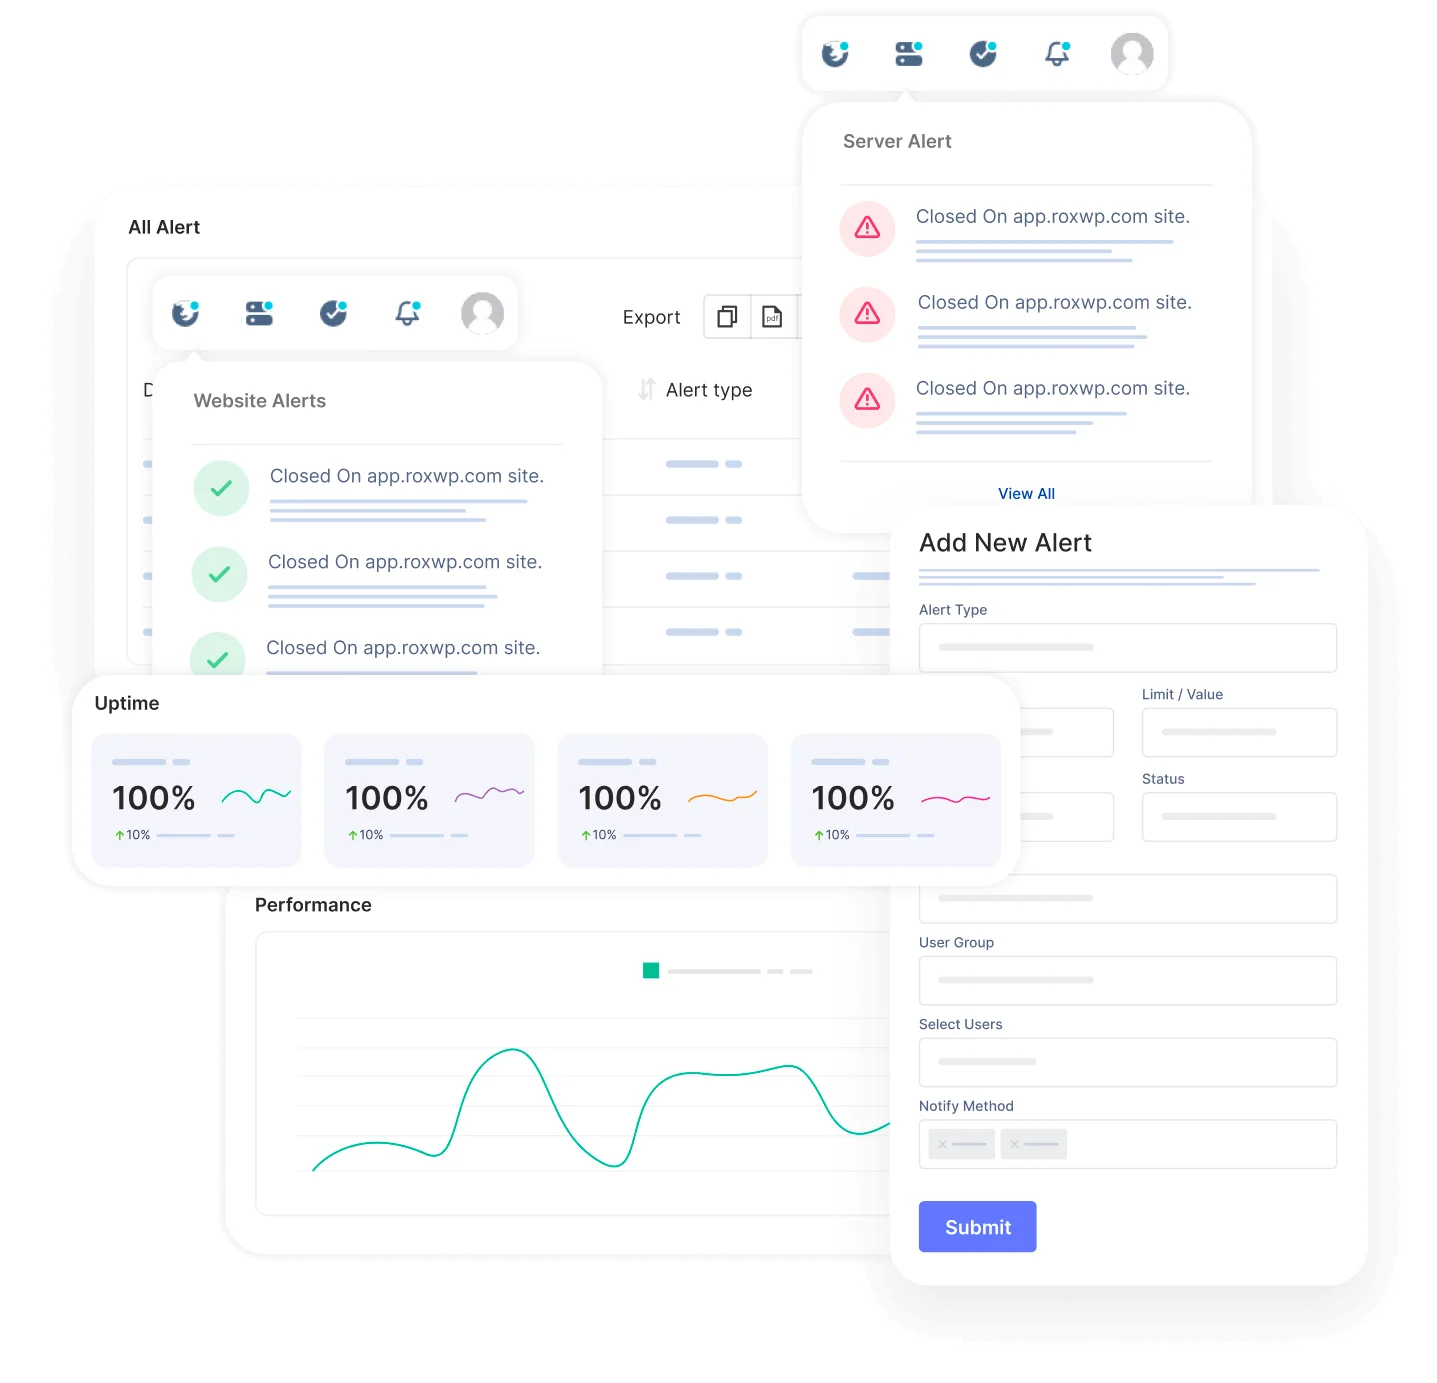
UptimeMonster
Reliable website and server monitoring service from the cloud to monitor your web availability, performance, and security. The tool will give you a 24/7 website monitoring service that will Monitor the availability of your website, APIs, and business-critical web transactions with powerful synthetic monitoring and testing tools.
It collects, correlates, and monitors servers alongside data from the rest of your stack. UptimeMonster server monitoring allows you to visualize, analyze, and track down different query metrics happening on your server so that you can prevent them before anything goes wrong.
Monitor your network performance like IP, DNS, Service port, Application, and others using the check monitoring tools. It will enable you to understand the network behavior and track NetFlow.
UptimeMonster check monitoring service will give you full control over your network. The check monitoring types are as follows
- TCP (Transmission Control Protocol)
- ICMP PING (Internet Control Message Protocol)
- IP Blacklist
- UDP (User Datagram Protocol)
- DNS (Domain Name Server)
- Application Monitoring
With a status page, you can share your monitoring activities and incidents with customers. You can easily make our status page public or private. You can highly customize your status page and share it with your customers to reduce the number of customer support tickets.
Using the status page you can easily gain trust from your customers. The alert notification easily notifies your customers about any incidents so that they can take necessary steps to prevent the issue. So that they will always be prepared and stay tuned.
Create and customize intricate policies for the escalation of incidents by taking into consideration various factors, including the passage of time, the availability of your team, and the source or origin of the incident.
The primary advantage, however, lies in integrated incident management and alerting. This is particularly advantageous for DevOps teams aiming to streamline their stack and potentially handle everything from a unified platform, eliminating the necessity for additional platforms.
Key Features
- Reliable Website and Server Monitoring
- Network Performance Monitoring
- Check Monitoring Types
- Status Page Customization
- Alert Notifications
- Incident Escalation Policies
- Incident Timeline
- SSL Expiration Monitoring
- Search String Monitoring
- Monitoring for HTTP(s), Ping, Port, DNS, SSL & TLD expiration, Cron jobs
- Unlimited email and push notification alerts
- Capture screenshots & error logs for incidents
Pros
- Reliable Uptime Monitoring
- Easy Setup and Configuration:
- Cost-Efficiency
- Customer Support:
- Accurate Reporting:
- User-Friendly Interface
- Customizable Alerts
- Status Page
- Escalation policies
- Incident Timeline Report
Cons
According to user reviews, UptimeMonster doesn’t exhibit any notable drawbacks. However, a few users have highlighted certain feature limitations present in the free plan offering. These limitations might include restricted access to certain functionalities or reduced capabilities compared to the premium plans. Despite this, the overall consensus from users is overwhelmingly positive regarding the platform’s performance and functionality.
Our perspective on this matter revolves around the notion that smaller teams might not necessitate the utilization of numerous advanced features. Therefore, it appears reasonable to curtail access to certain functionalities, considering that smaller teams might not require or fully utilize these advanced features. This approach ensures a streamlined and more focused user experience, optimizing the platform’s usability for smaller teams with specific needs.
Pricing
- Standard plan at $7/month with 30 monitors and 2-minute interval
- Professional plan at $19/month with 50 monitors and 1-minute interval
- Business plan at $99/month with 100 monitors and 25-second interval
Uptrends
Uptrends is a comprehensive website and server monitoring service designed to ensure your online assets’ continuous availability, performance, and security. With powerful synthetic monitoring and testing tools, Uptrends enables 24/7 monitoring of your websites, APIs, and critical web transactions. The platform goes beyond basic uptime checks, allowing you to collect, correlate, and monitor data from your servers, offering insights into various query metrics to prevent issues before they impact your operations.
Uptrends covers a spectrum of network performance aspects, including IP, DNS, service port, and application monitoring through its check monitoring tools. These tools provide detailed insights into network behavior, allowing users to track NetFlow and gain a thorough understanding of their network’s performance.
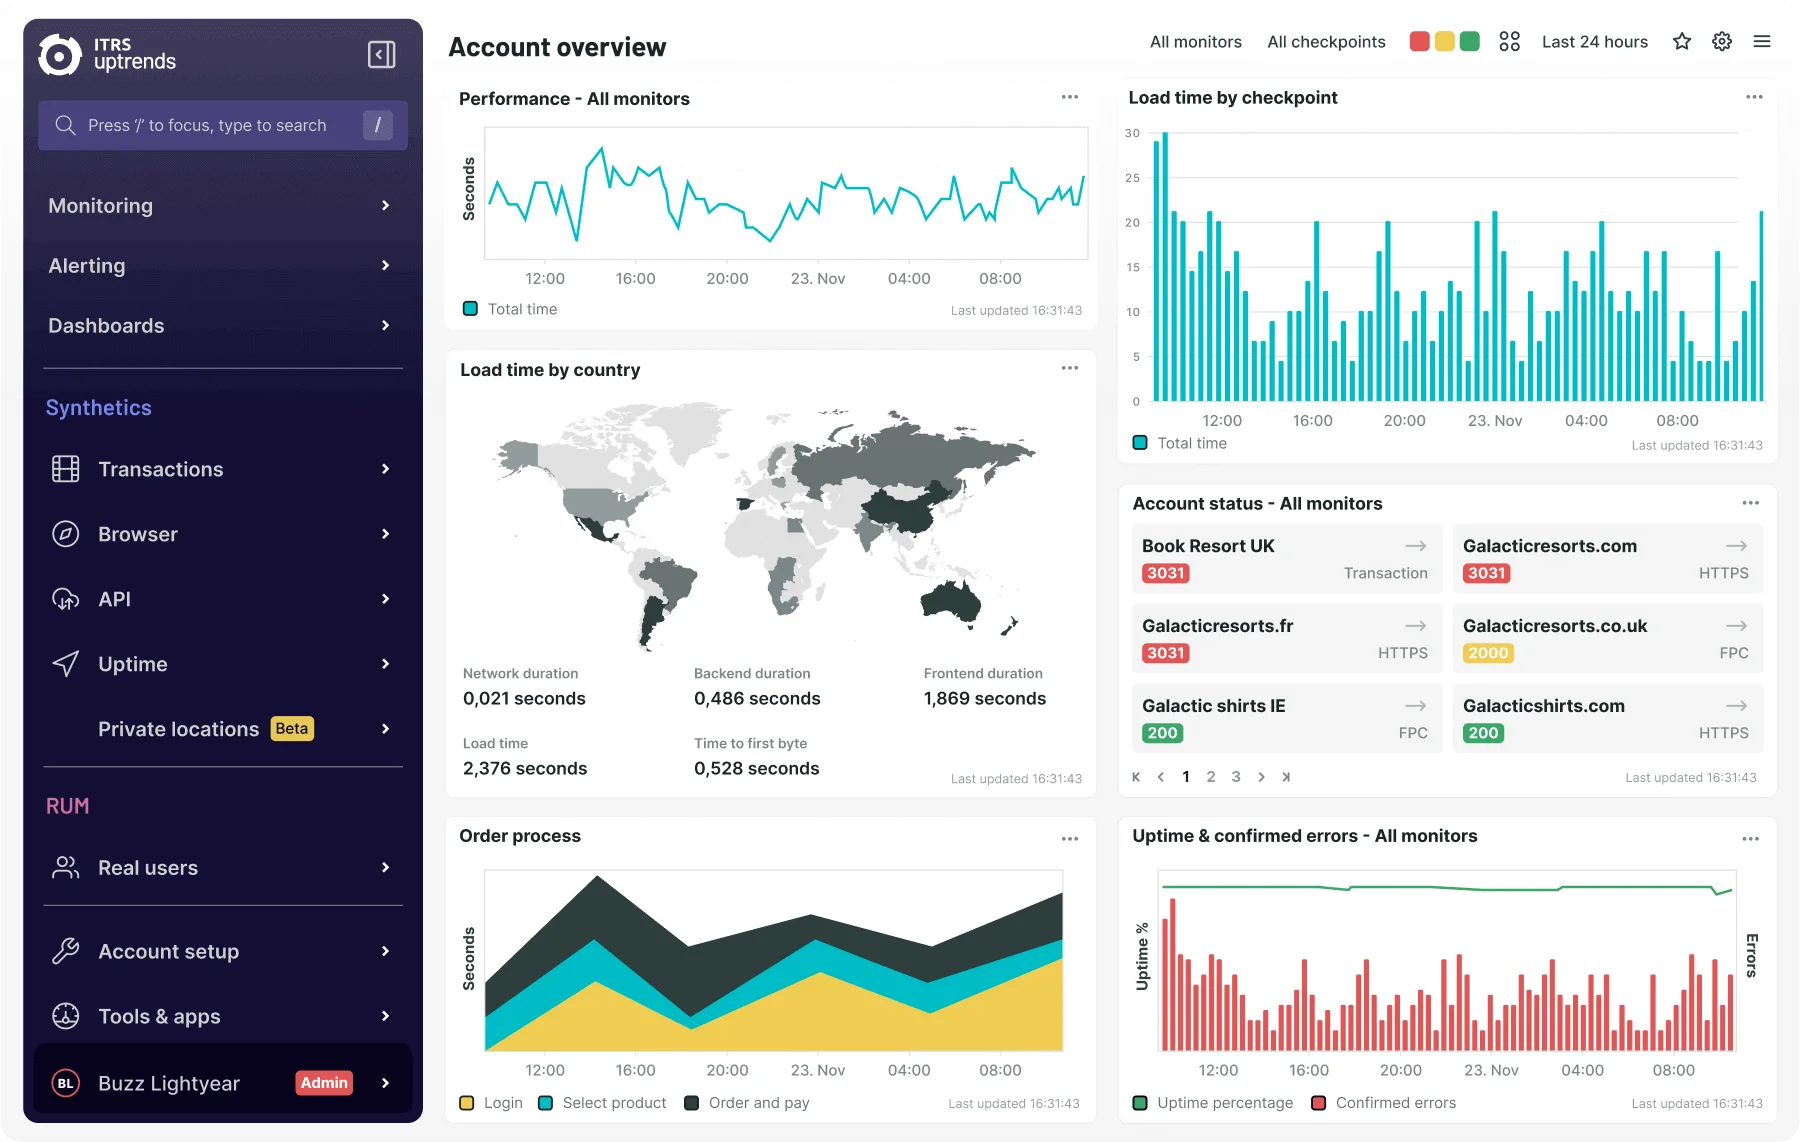
Key Features
- Integration
- Alerting
- Monitoring checkpoint
- Private recorder
- Transaction recorder
- Mobile app
- Public status page
- Custom metrics
- Concurrent monitoring
Pros
- Detailed alerts in case a check fails with error codes
- Available checkpoint
- Supports
- Easy to control multi-user access
- Ease of use
Cons
- The dashboards provide many options, so it can sometimes be confusing to know where to find exactly what you’re looking for.
- It also takes quite some time to set up things properly to avoid alert fatigue.
- Identifying the root cause of an uptrend poses a significant challenge due to its fluctuating nature involving both highs and lows, potentially impacting a business in either a positive or negative manner.
- Expensive
- The timeframes to monitor are not easily defined and implemented.
- Email alert notification charge
Pricing
Business plan starting at $100/month for organizations with fewer than 5 websites, applications, or APIs.
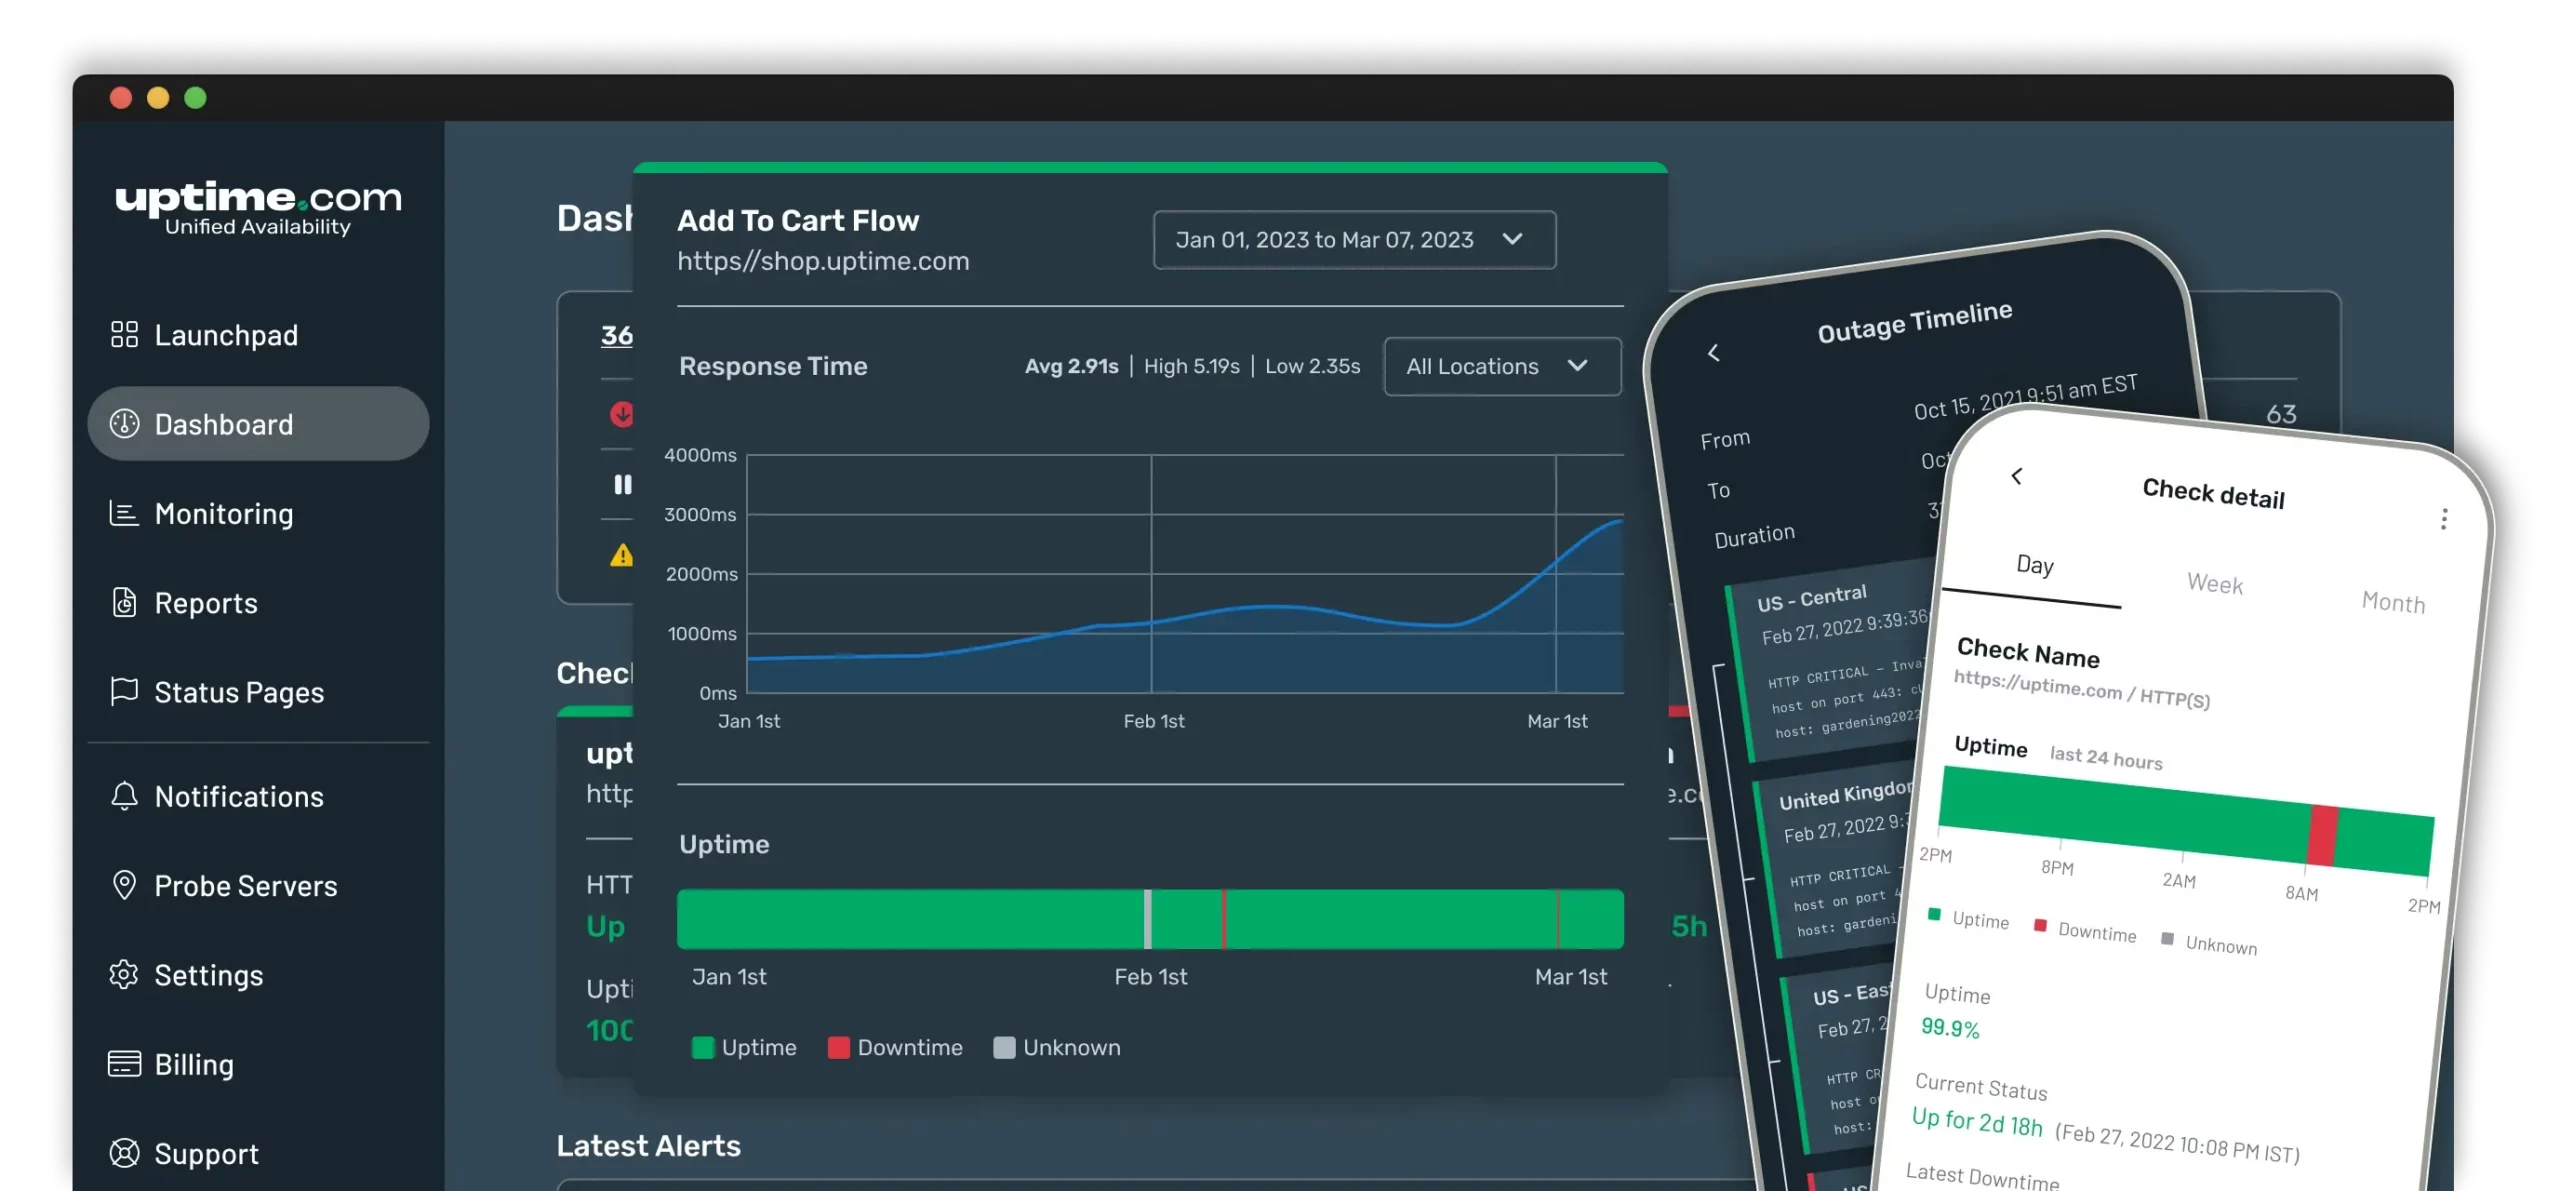
Uptime.com
Uptime.com is so expensive. Besides it doesn’t offer any free package. It also provides unmatched visibility and availability, empowering engineering, operations, and SRE teams to monitor & respond to their most essential services.
The Starter plan starts at $20 per month which includes 20 basic checks, no status page, and groups that are not included in this package. While Uptime.com’s pricing structure may position it as a relatively expensive alternative. It’s essential to recognize the company’s established reputation and consider whether the pricing aligns with the perceived reliability of its systems.
 Pros
Pros
- Notifies quickly of any detected issues
- Robust API
- Multiple monitoring locations
- Easy configuration
- Insight reporting
Cons
- More expensive than other tools
- The timeout limit of 60sec on the transactions was a bit difficult to manage for some users
- Fales notification issue if the monitor is not configured properly
- Public status pages could be more configurable
Pricing
- Starter package – $20/month with 20 checks
- Essential package – $67/month with 40 checks
- Premium package – $379/ month with 200 checks
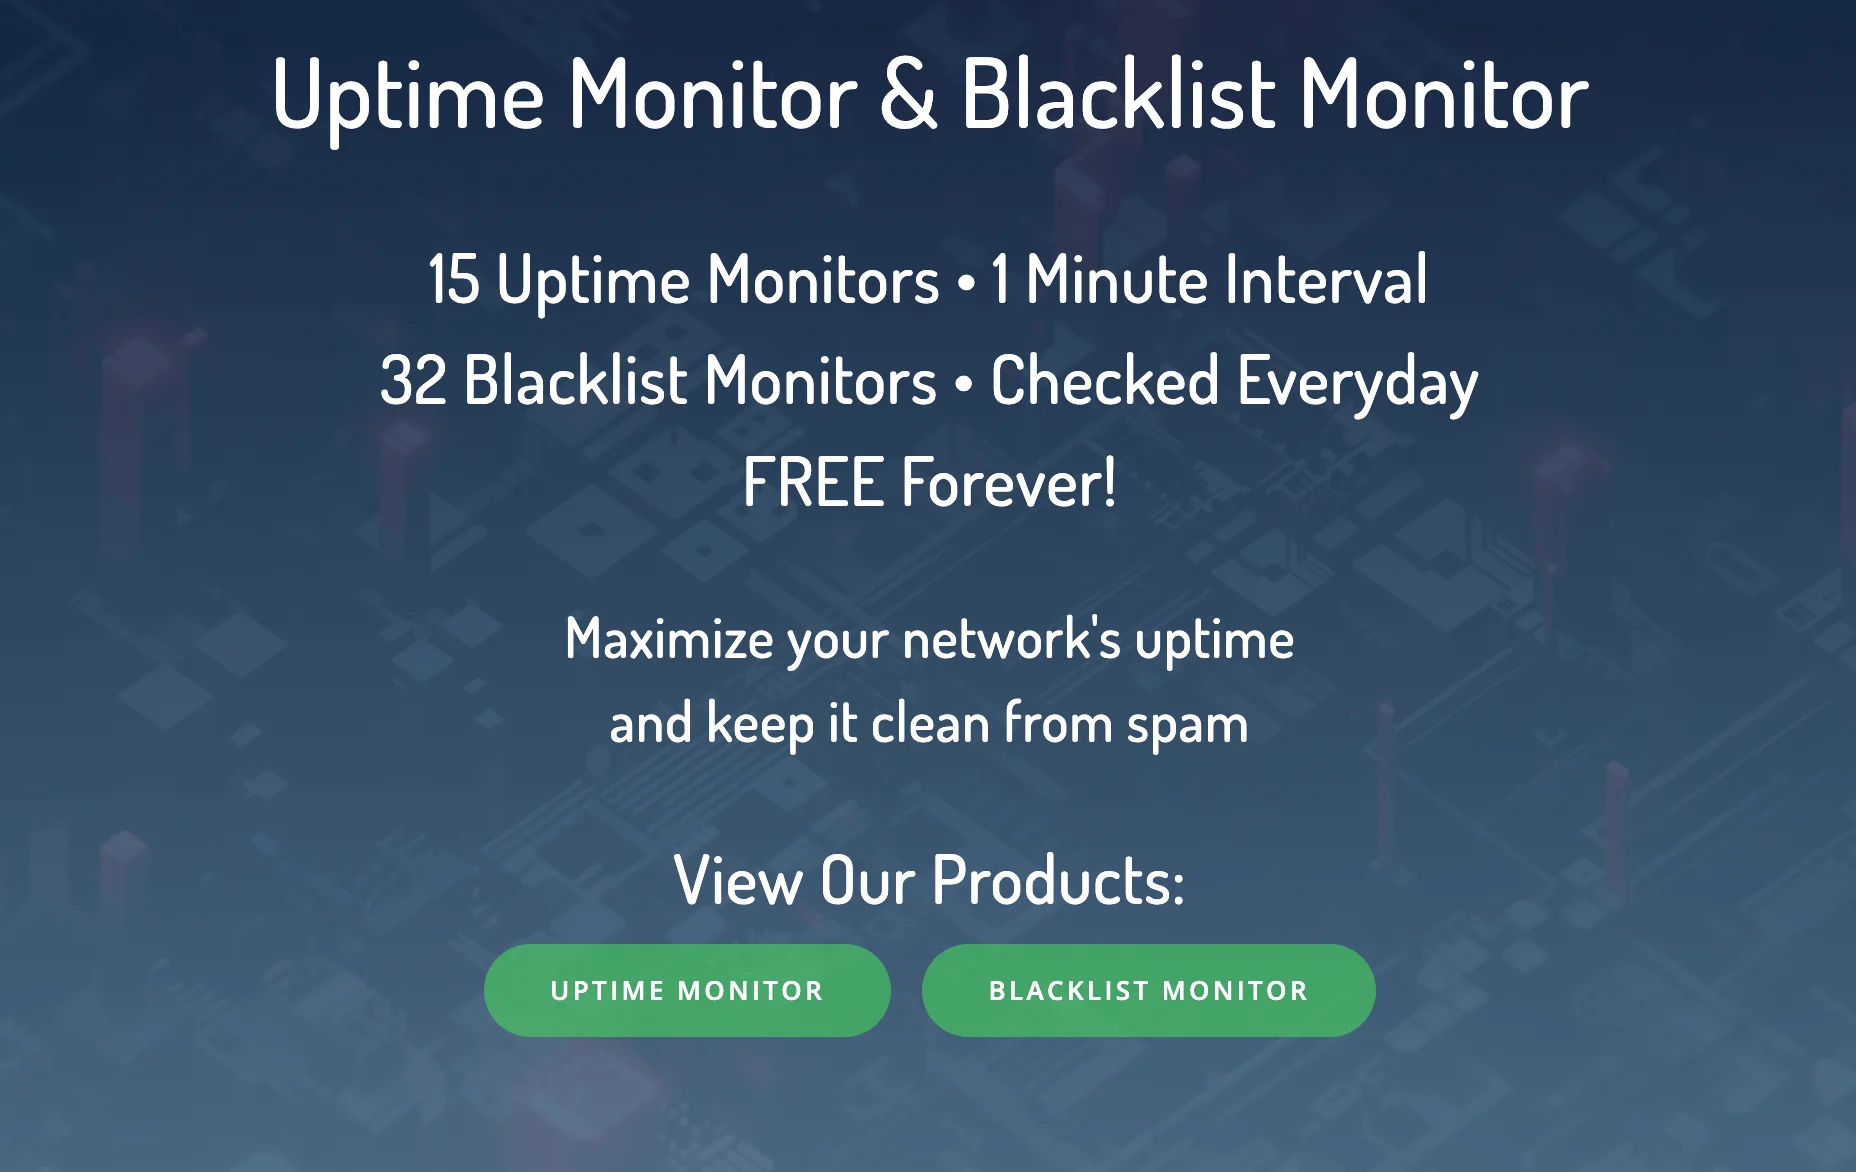
HetrixTools
HetrixTools is an easy-to-use uptime monitoring and blacklist check tool. With Hetrix tools you can select to monitor your website or server from up to 12 different locations around the world. Each one of your Uptime Monitors will have a neatly organized Uptime Report, which will contain all of its history, such as recorded outages, errors, response time, etc. Every Uptime Report is private by default, which means that only you (as a logged-in user) can view it, but you can also choose to make it public and share it with your colleagues or clients.
Every Uptime Monitor comes with detailed reporting, encompassing its entire history, including recorded outages, errors, response times, and more. By default, each Uptime Report is private, ensuring that only you, as a logged-in user, have access. However, you also have the option to make it public, allowing you to share it with colleagues or clients as needed.
Pros
- Blacklist monitoring
- Customizable alerts and notification
- User-friendly interface
- Reporting
- Pricing
- Geographical monitoring
Cons
- Network problem
- Security issue
- Adaptability
- Customization and flexibility
Pricing
- Professional – $9.95/month
- Business – $19.95/month
- Enterprise – $49.95/month
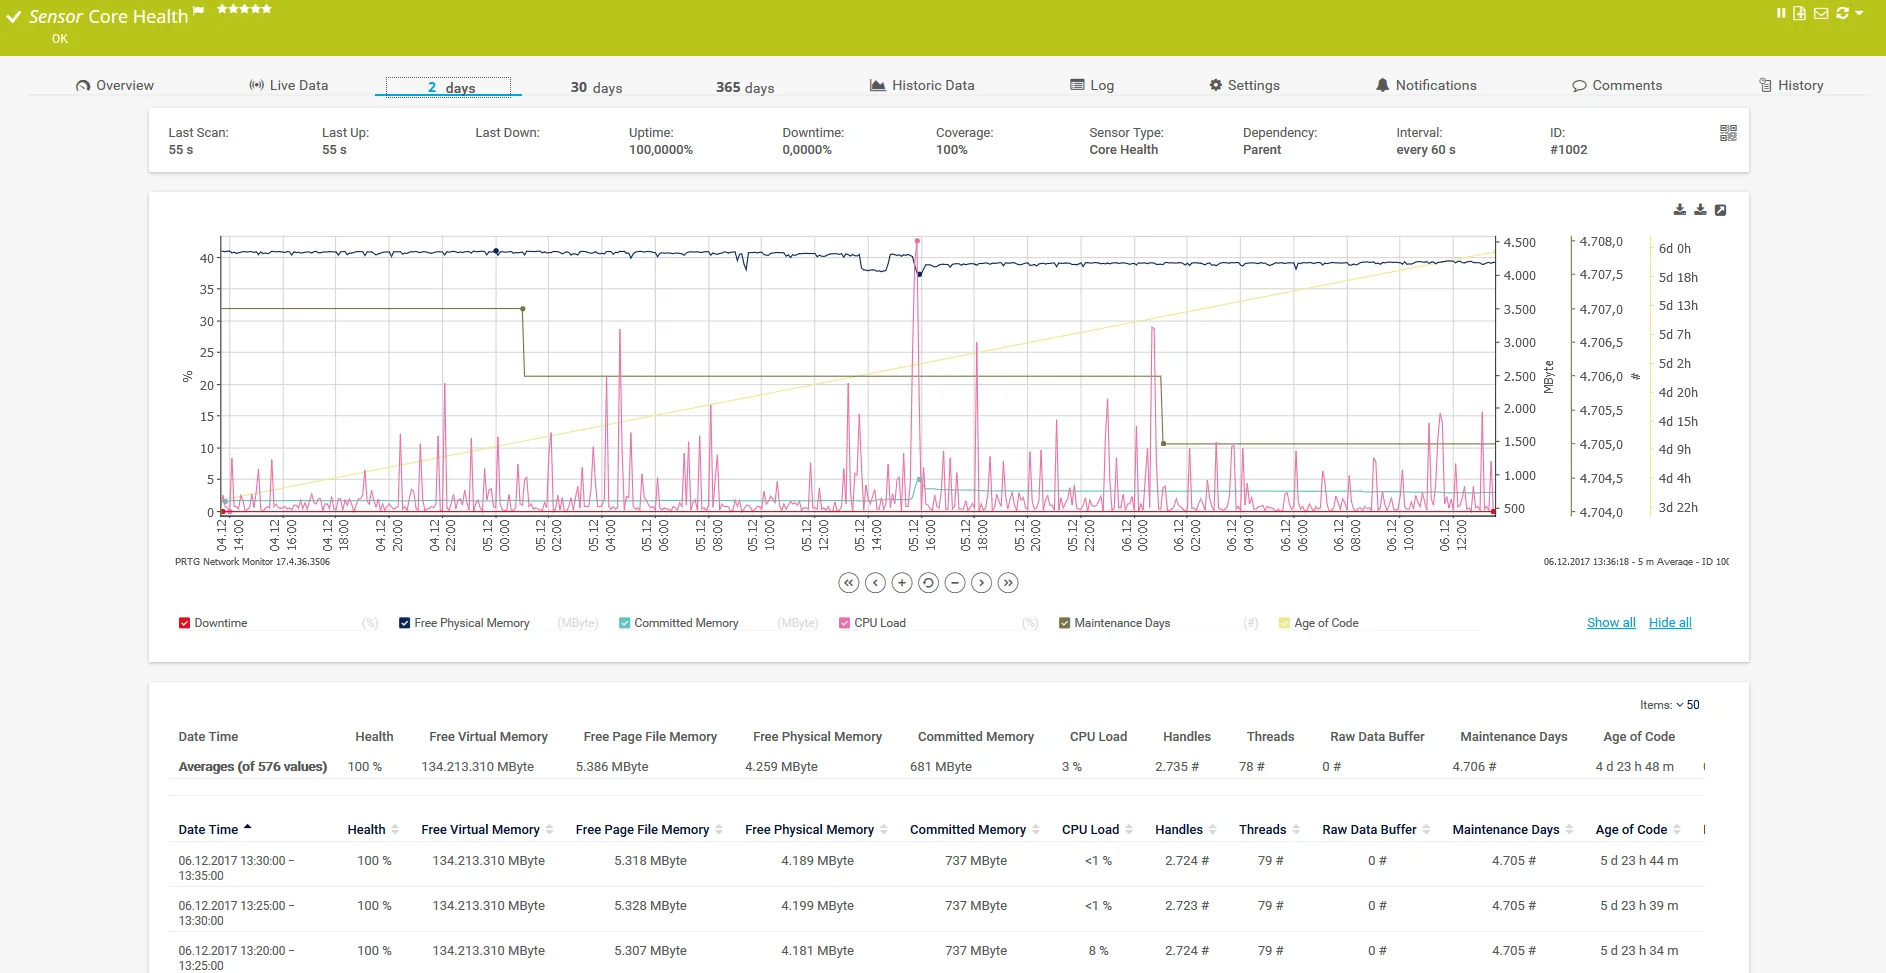
Paessler PRTG Network Monitoring
PRTG network monitoring solution is designed to track network up/down status, traffic, and usage. Key features encompass availability, performance, and bandwidth monitoring through SNMP, WMI, packet sniffing, and NetFlow. Instant alerts, comprehensive reporting, and failover clustering are included.
PRTG Network Monitor operates as an agentless solution, eliminating the need for agent installations on target devices and applications. Instead, it utilizes network protocols like SNMP, WMI, NetFlow, or SSH for efficient and swift monitoring. This approach reduces the burden and ensures a seamless monitoring experience.
Key Features
- In-depth Reporting
- Maps and Dashboards
- Flexible Alerting
- Distributed Monitoring
- Cluster Failover Solution
- Multiple User Interfaces
Pros
- Agentless Monitoring
- Varied Network Protocols
- Customizable package
- Traffic management and comprehensive monitoring of network devices.
- Enables full-stack monitoring for a holistic view of the system.
Cons
- No patch manager
- Limited historical data in the free version
- It’s Windows base especially so managing too many Linux machines causes issues
- Licensing can be tricky as it is not based on devices but rather on sensors. Currently, each sensor, such as an interface, is counted as a sensor license.
- Maps are difficult to make
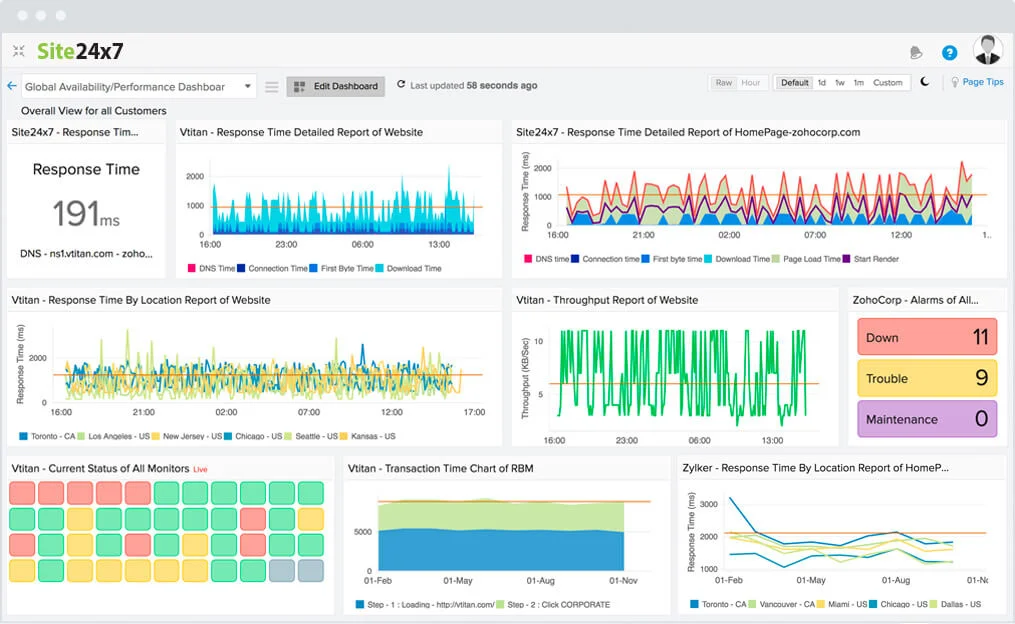
Site24x7
Site24x7 is a comprehensive website monitoring solution designed to ensure the optimal performance and availability of websites, servers, applications, and networks. The platform delivers automated network discovery and inventory management, coupled with the automatic generation of a network topology map.
It extends its monitoring capabilities across multiple sites and internet connections, including tracking the performance of web applications and websites.
Encompassing all IT assets, the Site24x7 system ensures complete stack observability. This facilitates instant root cause analysis in the event of any issues. For instance, if there’s a slowdown in application delivery, immediate insights will reveal whether it’s a network-related problem. Notifications about network device issues are promptly relayed, aiding proactive issue resolution.
Key Features
- Website Monitoring
- Server Monitoring
- Synthetic Web Transaction Monitoring
- Application Performance Monitoring
- Network Monitoring
- Public and Private Cloud Monitoring
- Real User Monitoring | RUM
- Cloud Cost Management
- Public Status Pages
- RMM for MSPs and CSPs
- Log Management from the Cloud
Pros
- Monitor Web applications and websites effectively.
- Track the performance of systems hosted both on-premises and in the cloud
- Full stack observability ensures immediate identification of root causes
- Ease of Use
- Integration Capabilities
Cons
- The setup of the Realtime user monitor was not as functional as expected about adding 3rd party scripts.
- Takes a long time to set up everything for monitoring
- Occasional False Positives
- Costly
Pricing
- Pro plan at $35 with 40 monitors
- Classic plan at $89 with 100 monitors
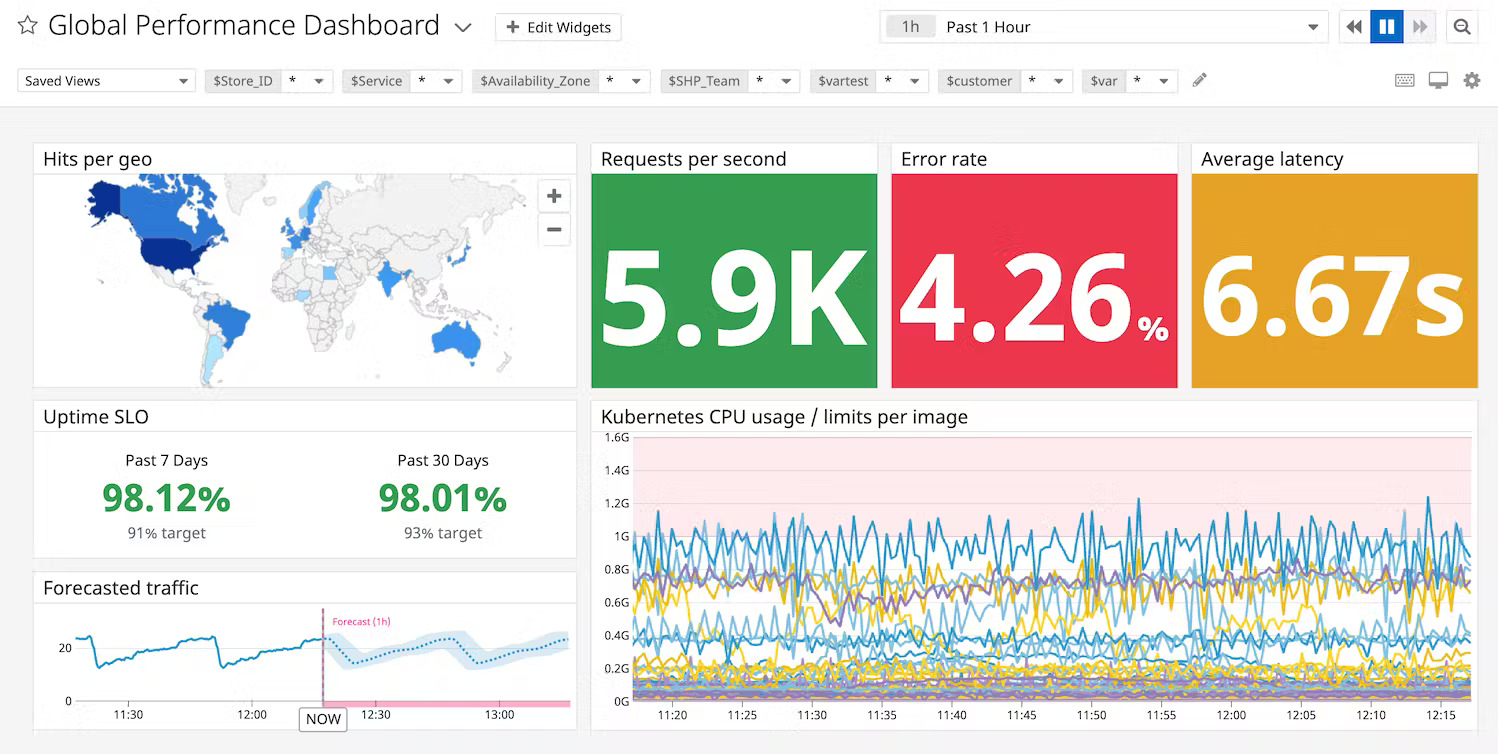
DataDog
Datadog’s website monitoring stands out as a comprehensive solution that offers unparalleled visibility. It goes beyond mere aggregation by seamlessly collecting metrics and events from an extensive range of over 500 integrated technologies, tagging and storing them for further analysis.
Notably, Datadog streamlines the entire process by taking care of the ingestion, normalization, and enrichment of logs, allowing users to focus on deriving meaningful insights rather than grappling with technical intricacies. This ensures a user-friendly experience and maximizes the efficiency of log management operations.
Furthermore, Datadog doesn’t stop at threat identification; it actively tracks the performance impact of every deployed code. This automated tracking extends to mapping data flows and dependencies through a service map, offering a visual representation of the intricate relationships within the infrastructure. By doing so, Datadog not only ensures robust security but also provides valuable insights into the operational dynamics of the entire system.
Pros
- Real-time log tracking
- Security monitoring
- Integrations
- Alerting system
- Custom downtime for deployment
Cons
- The primary weakness of Datadog lies in its scaling capabilities. Increasing metrics monitoring necessitates additional monitors, significantly impacting monthly billing and leading to high expenses.
- Datadog’s complexity might pose challenges, particularly for users unfamiliar with monitoring systems. Navigating and finding specific functionalities can be challenging without prior experience.
- Immediate action is lacking when decommissioning a host. It takes up to 24 hours for a host to be officially removed from the list, causing delays in real-time updates upon decommissioning.
- The basic plugins in Datadog offer limited information. Users often need to configure their plugins to obtain more detailed reports, adding complexity to data retrieval.
- Graphical reports in Datadog are not intuitively comprehensive, failing to provide easily understandable and valuable information to users.
Pricing
- Pro package at $15 per host/per month
- Enterprise package at $23 per host/per month
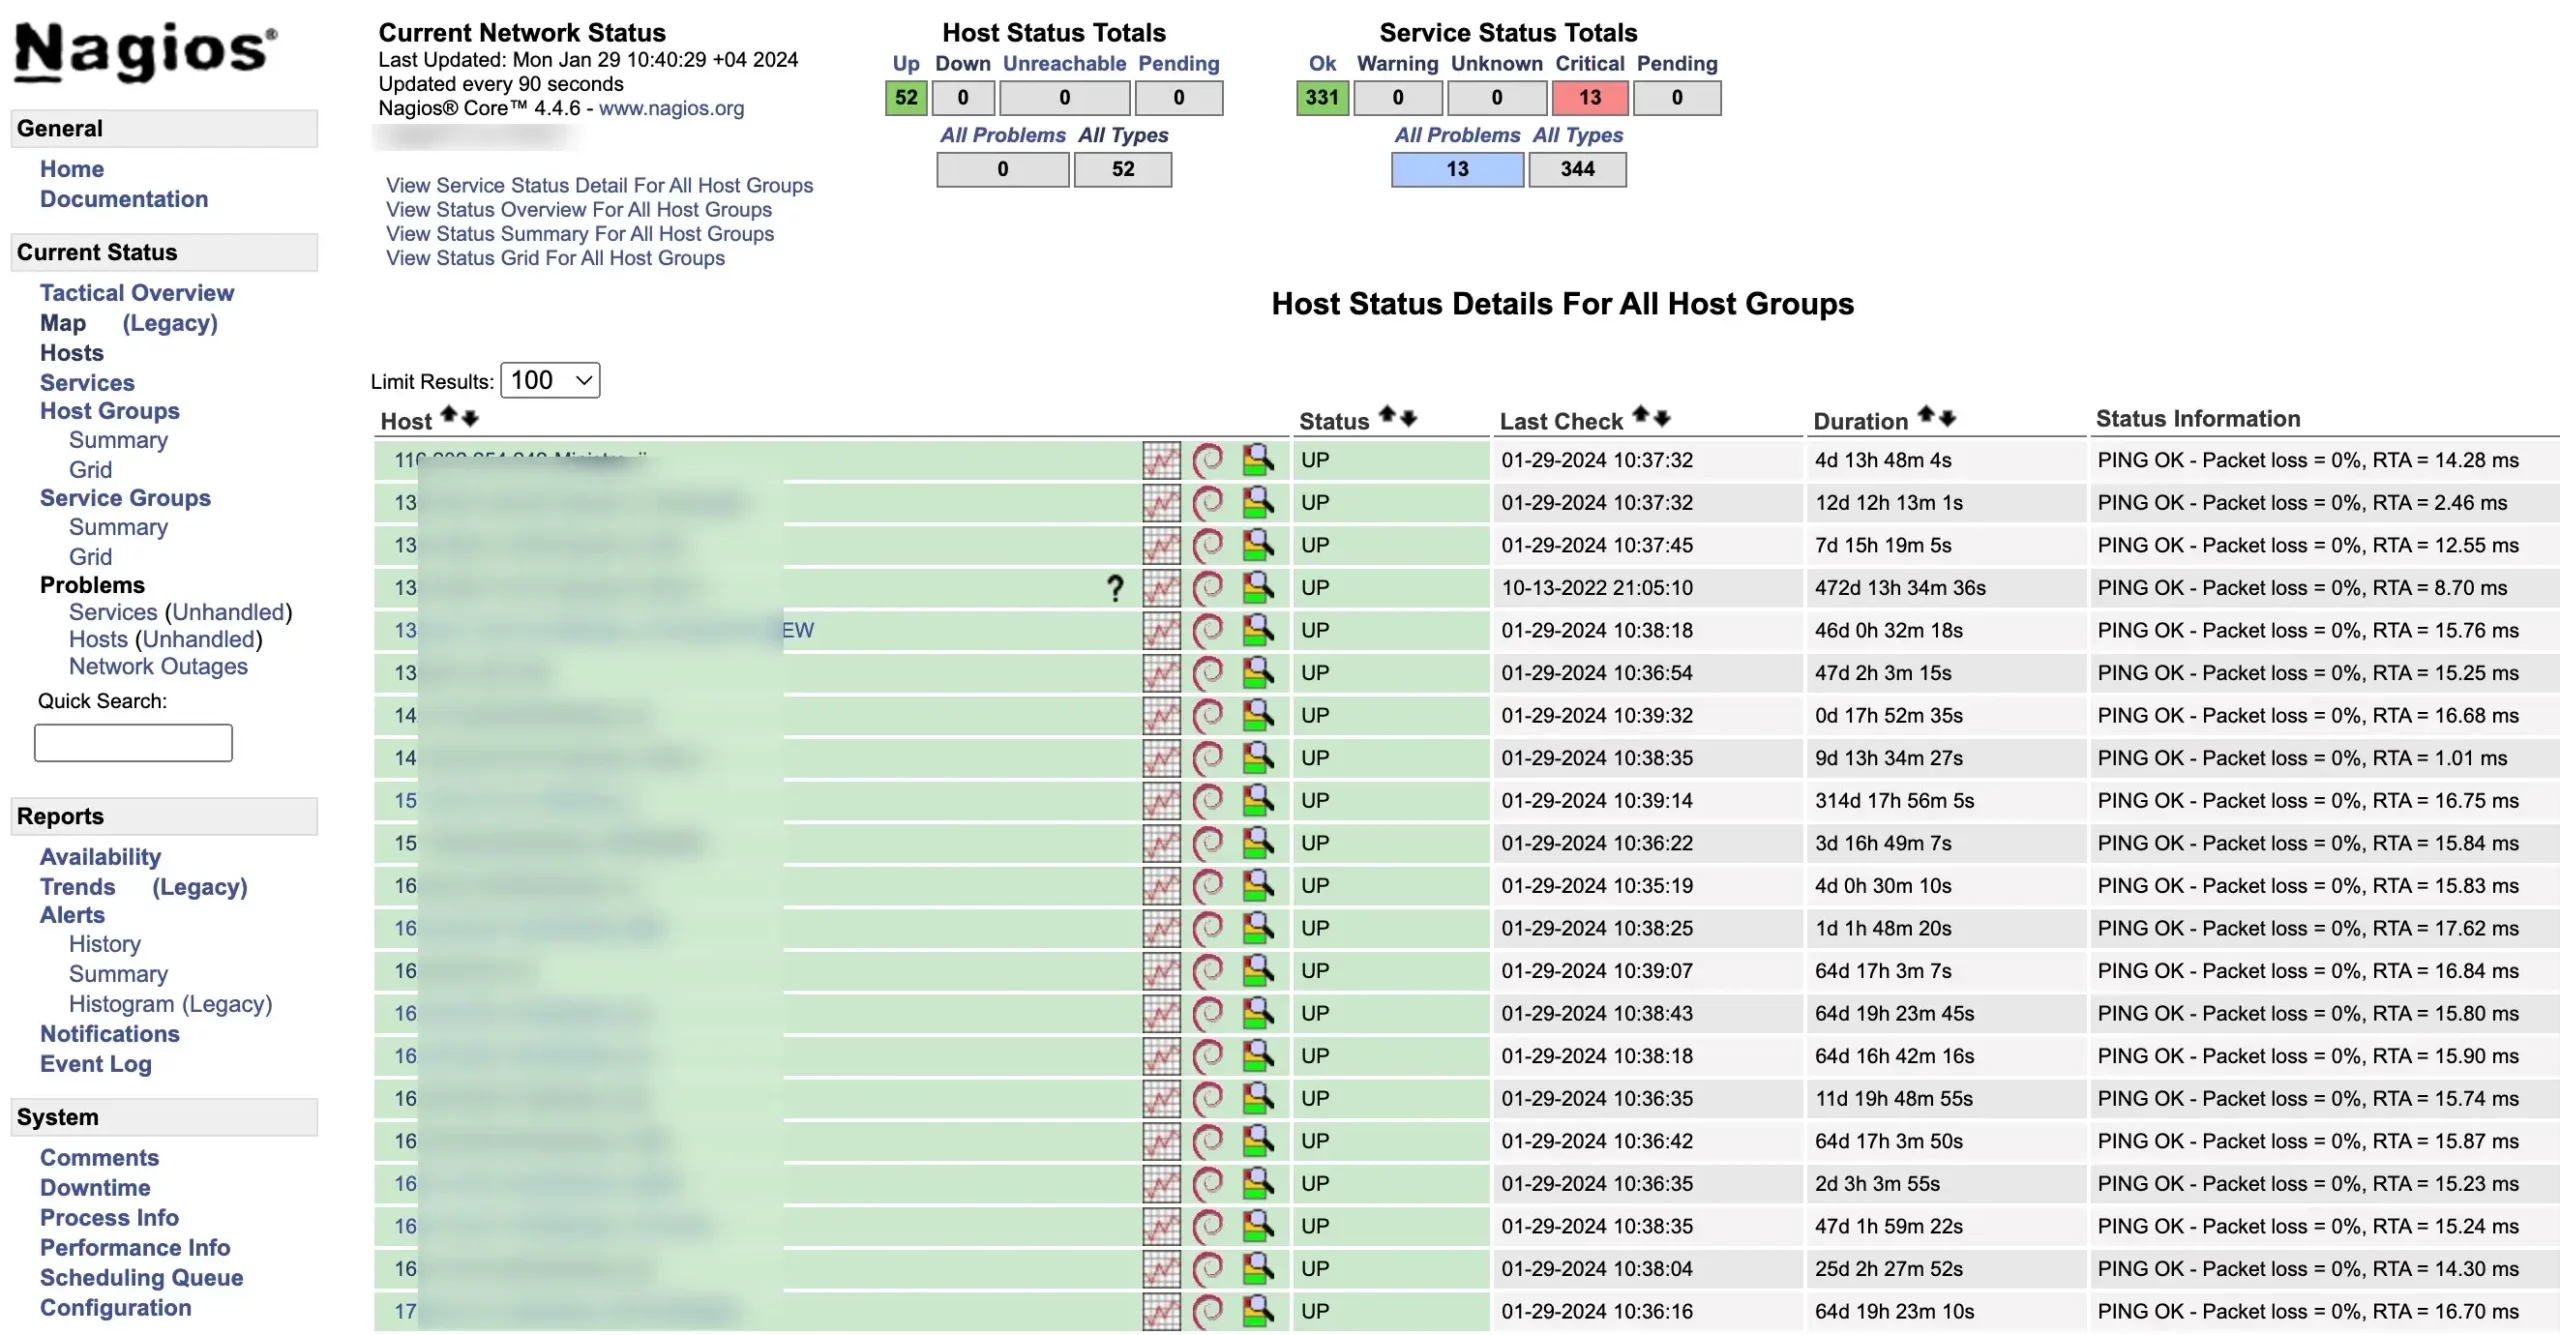
Nagios
Nagios is an open-source and commercial monitoring tool used by businesses of all sizes to keep their IT infrastructure up and running. It monitors everything from servers and networks to applications and services, alerting you to potential problems before they become critical.
Nagios XI diligently monitors various elements of your infrastructure, encompassing applications, operating systems, network architecture, network protocols, services, and system metrics. Its extensive library of hundreds of third-party add-ons empowers you to monitor virtually any internal or external program, service, or system with flexibility and adaptability.
Nagios Fusion unites dispersed Nagios XI and Core servers, granting panoramic network oversight and simplifying issue resolution across vast networks. Centralize diverse Nagios deployments with Fusion, boosting scalability and resolving geographically scattered network issues effortlessly.
Key Features:
- Monitoring of various IT components: Nagios can monitor servers, networks, applications, services, and more. It supports various protocols like SNMP, Ping, SSH, and WMI to collect data from different devices and systems.
- Customizable alerts and notifications: You can define custom alerts and notifications for different types of issues. Nagios can send alerts via email, SMS, instant messaging, or other channels to ensure the right people are notified promptly.
- Reporting and data analysis: Nagios provides comprehensive reports and data analysis to help you track trends, identify potential issues, and improve the performance of your IT infrastructure.
- Flexible and scalable: Nagios is highly flexible and scalable. You can start with a basic setup and add more features and functionality as your needs grow.
- Open-source and commercial options: Nagios Core is an open-source solution, while Nagios XI is a commercial version with additional features and enterprise-grade support.
Pros
- Highly customizable: Nagios can be customized to meet the specific needs of your IT infrastructure.
- Wide range of features: Nagios offers a wide range of features for monitoring different aspects of your IT environment.
- Powerful alerting system: Nagios’ alerting system ensures that you are notified of potential problems promptly.
- Active community: Nagios has a large and active community that provides support and helps you troubleshoot any issues.
- Cost-effective: Nagios Core is free to use, and Nagios XI is relatively affordable compared to other monitoring solutions
- Integration Capabilities: Nagios seamlessly integrates with various third-party tools and services, fostering compatibility and expanding its functionality according to organizational needs.
Cons
- Can be complex to set up: Nagios can be complex to set up for beginners, especially the open-source version.
- Requires technical expertise: Using and maintaining Nagios effectively requires some technical expertise.
- Limited scalability for large enterprises: The open-source version of Nagios may not be scalable enough for large enterprises.
Pricing
- The initial cost for Nagios XI begins at $1,995 per instance, billed on an annual basis.
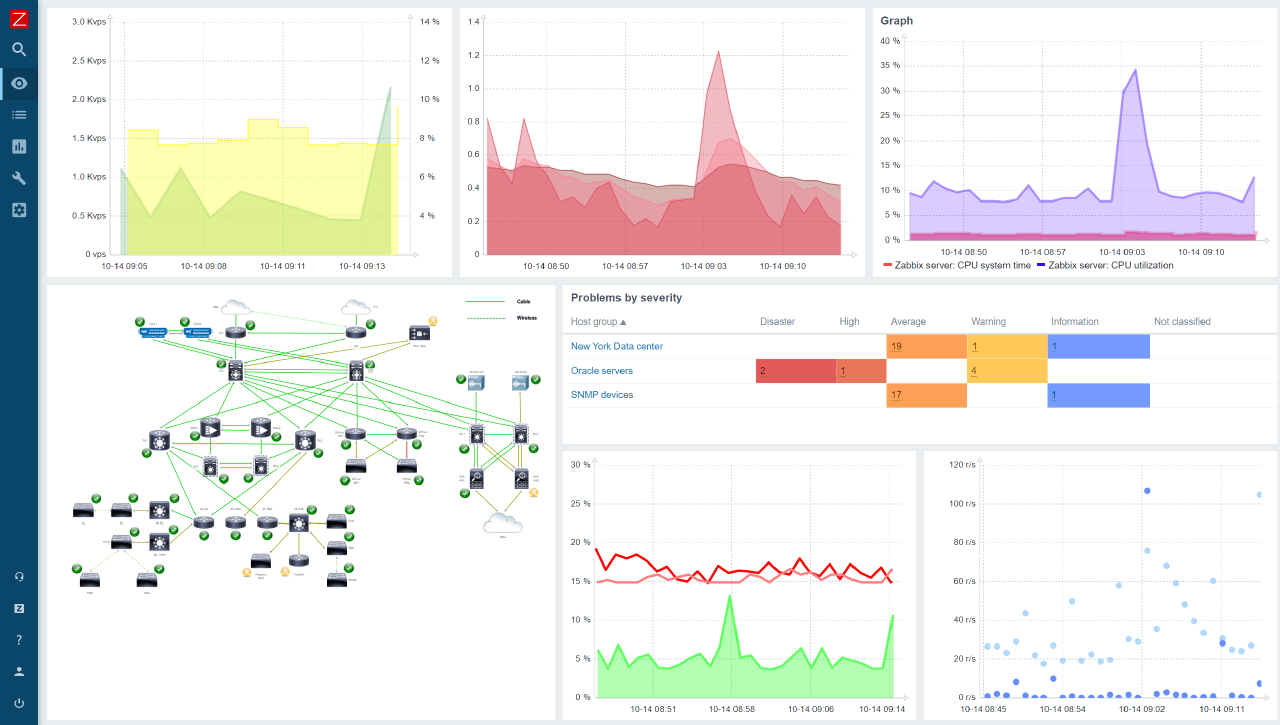
Zabbix
Zabbix is a powerful, enterprise-grade monitoring solution that keeps a watchful eye on your IT infrastructure, ensuring everything runs smoothly and efficiently. Whether you’re a small business or a large organization, Zabbix provides comprehensive monitoring capabilities to safeguard your critical systems and applications.
Utilizing an extensive range of data collection methods, including JMX, SNMP, WMI, IPMI, and customizable scripts, this software provides a precision-focused approach to network monitoring. It can adapt diverse monitoring requirements, whether in on-premise or cloud environments, catering to networks of varying complexities.
Key Features
- Trend Prediction: Anticipate future trends with Zabbix’s trend prediction feature, enabling proactive measures based on historical performance data.
- Automated Problem Resolution: Zabbix streamlines operations with automated problem resolution, minimizing manual intervention and ensuring swift responses to detected issues.
- Anomaly Detection: Uncover irregularities in your network’s behavior using Zabbix’s anomaly detection, providing early insights into potential performance deviations.
- High-Level Map Navigation: Gain a comprehensive understanding of network structure and dependencies through Zabbix’s high-level view with map navigation, offering a visual representation of your network landscape.
Zabbix seamlessly integrates with a diverse array of IT infrastructure components, fostering compatibility and interoperability:
- Database Harmony: Collaborate effortlessly with databases, as Zabbix aligns smoothly with MySQL, PostgreSQL, and Oracle, ensuring seamless data synchronization.
- Cloud Compatibility: Embrace cloud services without constraints—Zabbix extends its capabilities to work seamlessly with cloud giants such as AWS and Azure, providing holistic cloud monitoring.
- Interconnectivity with Monitoring Tools: Forge connections with other monitoring tools effortlessly, as Zabbix harmonizes with popular solutions like Grafana and Elasticsearch, offering a unified and synergized monitoring ecosystem.
Pros
- Versatile Data Collection Methods
- Scalable to Large Networks
- Open-Source and Cost-Effective
Cons
- Steeper Learning Curve
- GUI Could Be More Intuitive
- Requires In-House Expertise for Setup and Maintenance
Pricing
- Zabbix Core: Free and open-source, ideal for individuals, small businesses, and non-profit organizations.
- Zabbix Enterprise: Paid version with additional features like enhanced security, distributed monitoring, and high availability. Pricing depends on the number of monitored items and licenses.
- Zabbix Professional Support: Optional paid support plans for Zabbix Core and Zabbix Enterprise, offering faster response times, technical expertise, and access to exclusive resources.
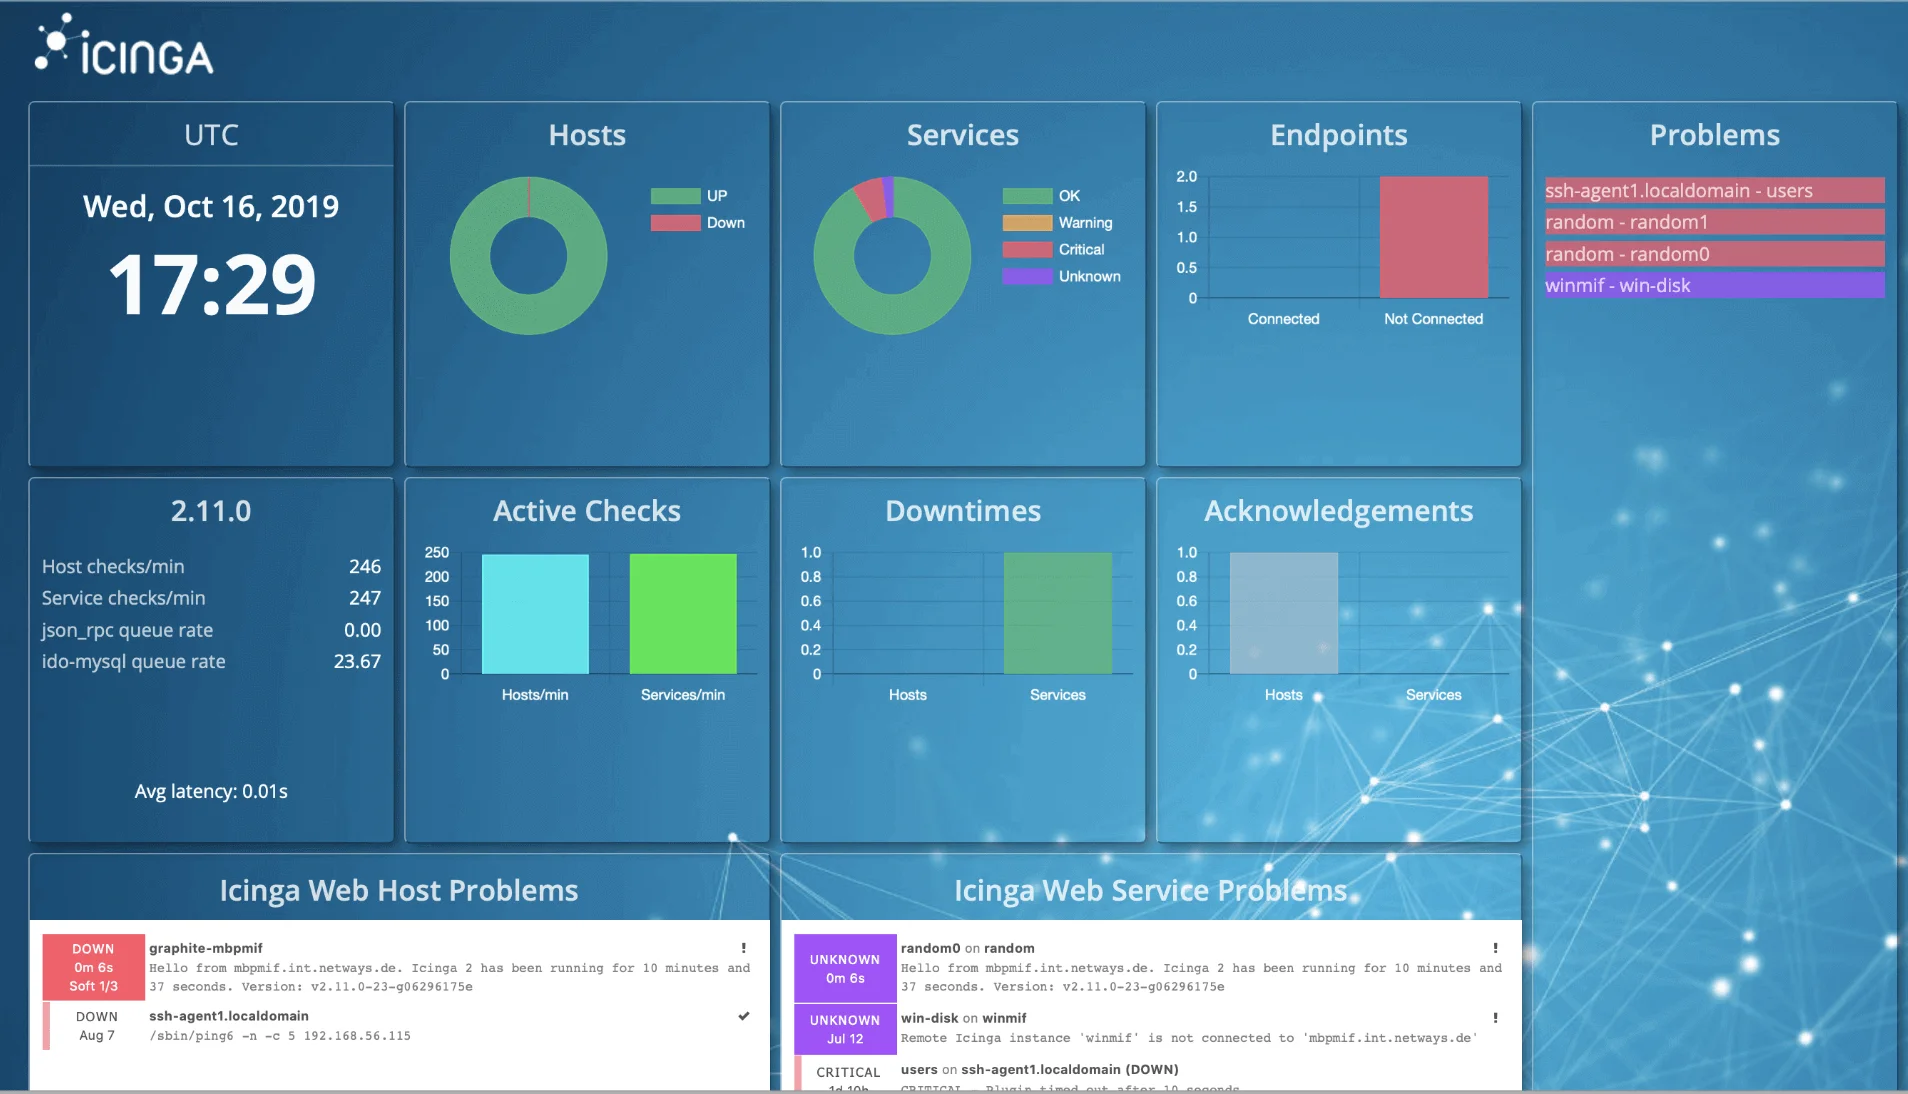
iCINGA
Icinga, an open-source network monitoring tool, delivers adaptable and scalable solutions for monitoring network resources, notifying users of outages, and supplying data for reporting purposes. Renowned for its extensible architecture, Icinga is an ideal choice for environments seeking a monitoring solution that is both customizable and scalable to their specific needs.
Its capability to seamlessly adapt to the expansion of an organization’s network and its capacity to integrate with a plethora of plugins and add-ons for enhanced functionality showcase its versatility.
Key Features
- Real-Time Network Monitoring: Icinga excels in real-time network monitoring, providing instant insights into the health and performance of critical network resources.
- Multi-Channel Notifications: Stay informed with notifications delivered through various channels, ensuring prompt alerts for any detected issues, and allowing for quick response and resolution.
- Customizable Reporting: Tailor your reporting to meet specific needs with Icinga’s customizable reporting capabilities, providing in-depth insights into network performance and trends.
- Web Interface for Management: With a user-friendly web interface, managing and visualizing network data becomes a seamless process, enhancing overall ease of use and accessibility.
- Integration with Graphite: Icinga seamlessly integrates with Graphite for efficient metrics storage and visualization, enhancing the analytical capabilities of network monitoring.
- Puppet Integration for Automation: Strengthen your network monitoring capabilities with integrations like Puppet for IT automation, enabling automated responses to identified issues and streamlining operational workflows.
Pros
- Open-source and Cost-effective
- Highly Flexible and Customizable
- Alerting and Reporting:
- Active Community and Support
- Lightweight and Scalable
Cons
- Initial Setup Complexity
- Documentation could be improved
- Interface can feel outdated
Pricing
As an open-source tool, Icinga is freely available for use. Besides, if your needs extend to enterprise-level features and dedicated support, Icinga provides commercial packages, and details regarding their pricing can be acquired through inquiry.
How to navigate the plethora of alternatives to New Relic?
Effective monitoring and observability are vital for applications in a production environment, and choosing the right tool for proactive management is paramount. While New Relic boasts capabilities, it faces challenges such as outdated documentation, intricate pricing structures, and a complex user interface.
Exploring alternatives to New Relic offers the potential to better meet your monitoring requirements. Consider the following factors when opting for a substitute:
- Cost: Look for solutions with transparent and predictable pricing to avoid unexpected costs like overage penalties.
- Support: Prioritize tools with robust customer support and an active community, especially during the transition to a new platform.
- Open-Source: Although not mandatory, an open-source tool provides transparency and customization options for developers.
- OpenTelemetry Support: Tools integrated with OpenTelemetry, like SigNoz, align with evolving standards for cloud-native application instrumentation.
- Data Security and Compliance: Ensure the chosen tool complies with data privacy and security standards, particularly concerning sensitive information.
- Trial Period and Transition Ease: Consider tools that offer a trial period and support a seamless transition from New Relic.
In this context, UptimeMonster emerges as a compelling alternative to New Relic, boasting comprehensive features and transparent pricing policies.