

Best Observium Alternative in 2024
![]() 8 Mins Read
8 Mins Read
Observium is a network monitoring and management platform that provides real-time insight into network health and performance. It can automatically discover network devices and services, collect performance metrics, and generate alerts when problems are detected.
Observium includes a web-based interface that allows users to view network status and performance metrics in real-time, as well as historical data. It is designed to be easy to use and maintain, with a focus on providing the information that network administrators need to identify and resolve issues quickly.
Challenges and Limitations of Observium
- There is limited customization on the dashboard
- The setup process is easy but the customization process is very complex.
- The documentation needs to be updated
- Server maintenance is difficult for beginners
- Mapping needs to be more specific
- UI is not more user-friendly
Best Observium Alternative
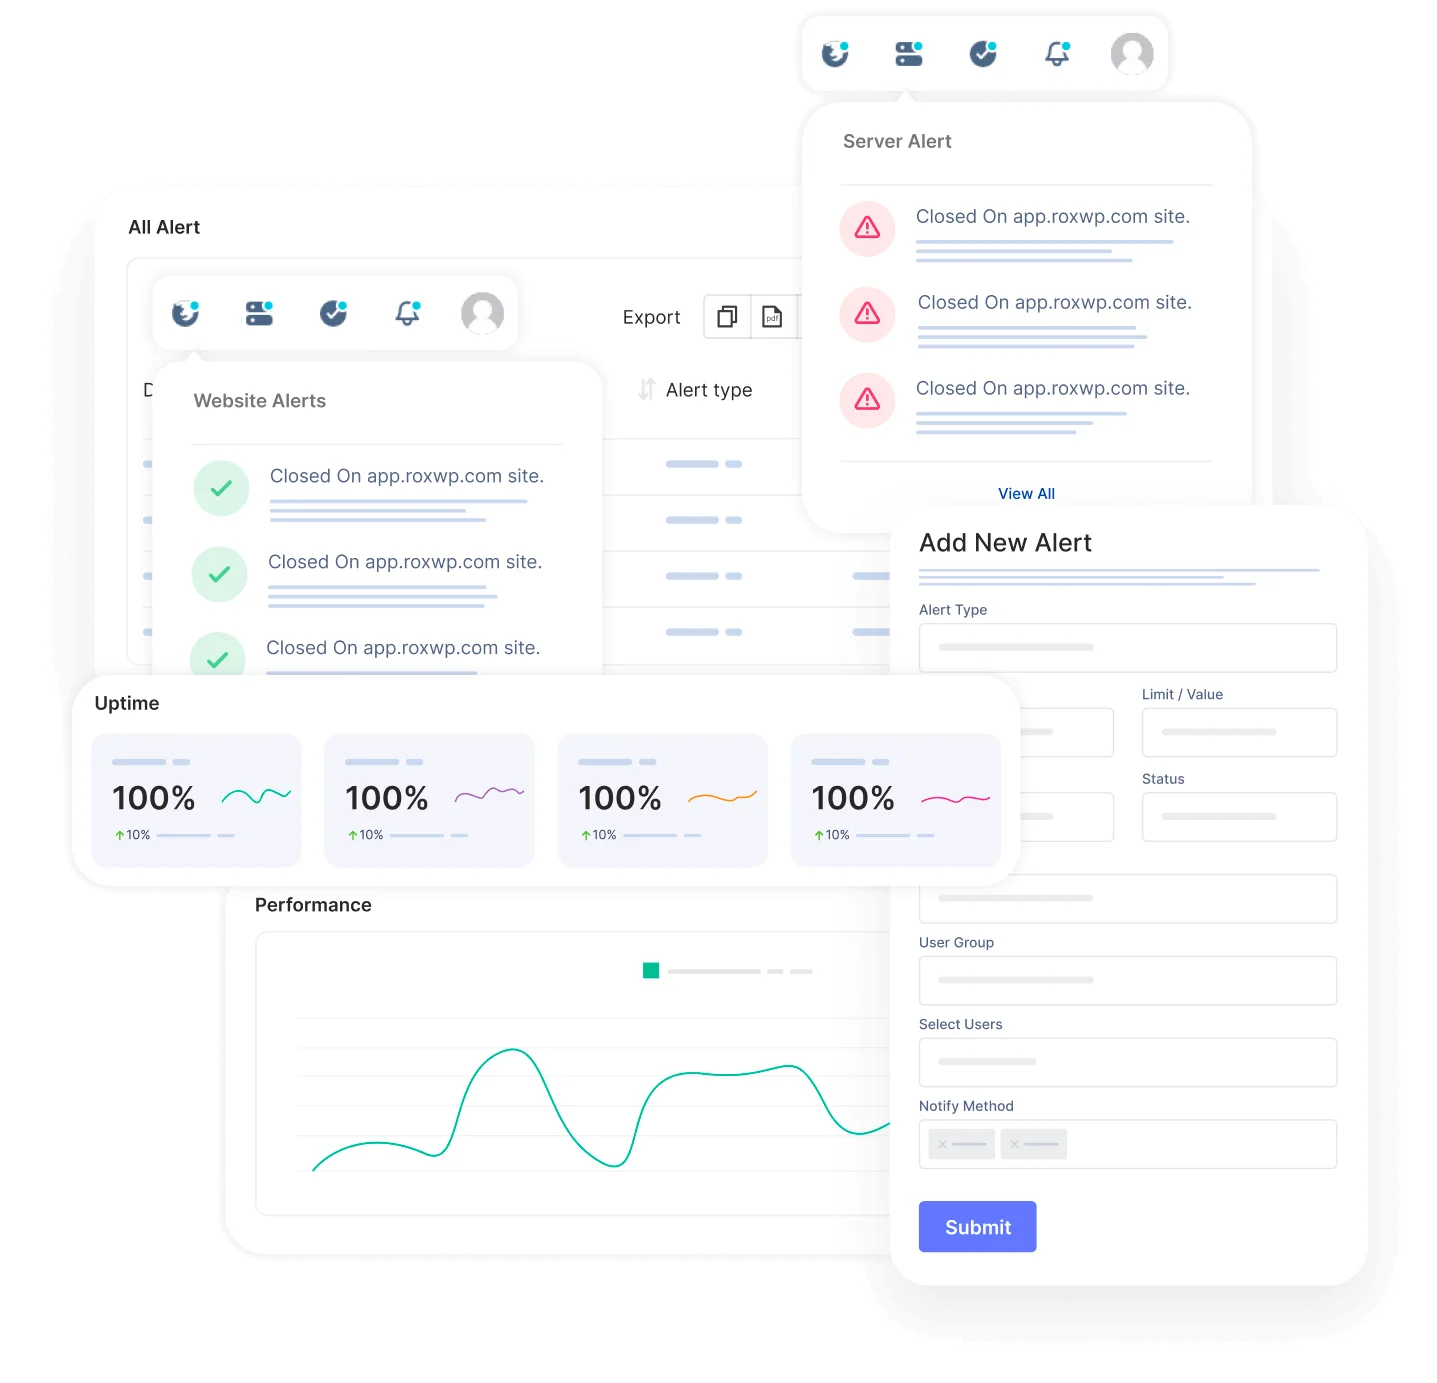
UptimeMonster
Even within its Free subscription tier, it presents the best alternative to Observium, boasting a checking frequency as frequent as every 3 minutes, which can be further enhanced to 30-second intervals with higher-tier plans. UptimeMonster integrates the best practices in uptime monitoring, incident management, and downtime communication through status pages.
With UptimeRobot users gain access to a comprehensive array of features including HTTP(s) keyword checks, multi-step verification, heartbeat monitoring, SSL, Ping, and more.
Each error is meticulously documented with a screenshot and a detailed second-by-second timeline. UptimeMonster conducts checks on websites and servers every 25 seconds from multiple locations, significantly reducing the occurrence of false alarms or issues related to location discrepancies.
UptimeMonster check monitoring service will give you full control over your network. The check monitoring types are as follows
- TCP (Transmission Control Protocol)
- ICMP PING (Internet Control Message Protocol)
- IP Blacklist
- UDP (User Datagram Protocol)
- DNS (Domain Name Server)
- Application Monitoring
With a status page, you can share your monitoring activities and incidents with customers. You can easily make our status page public or private. You can highly customize your status page and share it with your customers to reduce the number of customer support tickets.
Using the status page you can easily gain the trust of your customers. The alert notification easily notifies your customers about any incidents so that they can take necessary steps to prevent the issue. So that they will always be prepared and stay tuned.
Create and customize intricate policies for the escalation of incidents by taking into consideration various factors, including the passage of time, the availability of your team, and the source or origin of the incident.
The primary advantage, however, lies in integrated incident management and alerting. This is particularly advantageous for DevOps teams aiming to streamline their stack and potentially handle everything from a unified platform, eliminating the necessity for additional platforms.
Key Features
- Reliable Website and Server Monitoring
- Network Performance Monitoring
- Check Monitoring Types
- Status Page Customization
- Alert Notifications
- Incident Escalation Policies
- Incident Timeline
- SSL Expiration Monitoring
- Search String Monitoring
- Monitoring for HTTP(s), Ping, Port, DNS, SSL & TLD expiration, Cron jobs
- Unlimited email and push notification alerts
- Capture screenshots & error logs for incidents
Pros
- Reliable Uptime Monitoring
- Easy Setup and Configuration:
- Cost-Efficiency
- Customer Support:
- Accurate Reporting:
- User-Friendly Interface
- Customizable Alerts
- Status Page
- Escalation policies
- Incident Timeline Report
Cons
According to user reviews, UptimeMonster doesn’t exhibit any notable drawbacks. However, a few users have highlighted certain feature limitations present in the free plan offers. These limitations might include restricted access to certain functionalities or reduced capabilities compared to the premium plans. Despite this, the overall consensus from users is overwhelmingly positive regarding the platform’s performance and functionality.
Our perspective on this matter revolves around the notion that smaller teams might not necessitate the utilization of numerous advanced features. Therefore, it appears reasonable to curtail access to certain functionalities, considering that smaller teams might not require or fully utilize these advanced features. This approach ensures a streamlined and more focused user experience, optimizing the platform’s usability for smaller teams with specific needs.
Pricing
- Standard plan at $7/month with 30 monitors and 2-minute interval
- Professional plan at $19/month with 50 monitors and 1-minute interval
- Business plan at $99/month with 100 monitors and 25-second interval
Zabbix
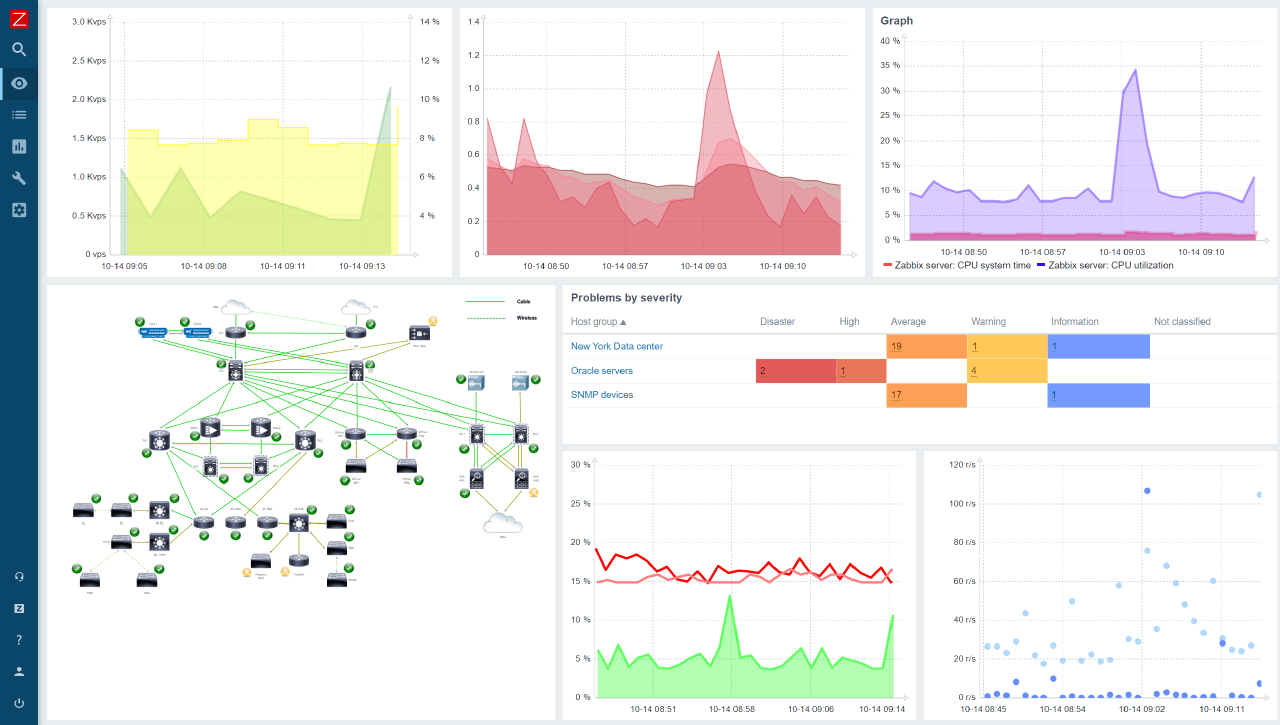
Zabbix is a powerful, enterprise-grade monitoring solution that keeps a watchful eye on your IT infrastructure, ensuring everything runs smoothly and efficiently. Whether you’re a small business or a large organization, Zabbix provides comprehensive monitoring capabilities to safeguard your critical systems and applications.
Utilizing an extensive range of data collection methods, including JMX, SNMP, WMI, IPMI, and customizable scripts, this software provides a precision-focused approach to network monitoring. It can adapt diverse monitoring requirements, whether in on-premise or cloud environments, catering to networks of varying complexities.
Key Features
- Trend Prediction: Anticipate future trends with Zabbix’s trend prediction feature, enabling proactive measures based on historical performance data.
- Automated Problem Resolution: Zabbix streamlines operations with automated problem resolution, minimizing manual intervention and ensuring swift responses to detected issues.
- Anomaly Detection: Uncover irregularities in your network’s behavior using Zabbix’s anomaly detection, providing early insights into potential performance deviations.
- High-Level Map Navigation: Gain a comprehensive understanding of network structure and dependencies through Zabbix’s high-level view with map navigation, offering a visual representation of your network landscape.
Pros
- Versatile Data Collection Methods
- Scalable to Large Networks
- Open-Source and Cost-Effective
Cons
- Steeper Learning Curve
- GUI Could Be More Intuitive
- Requires In-House Expertise for Setup and Maintenance
Site24x7
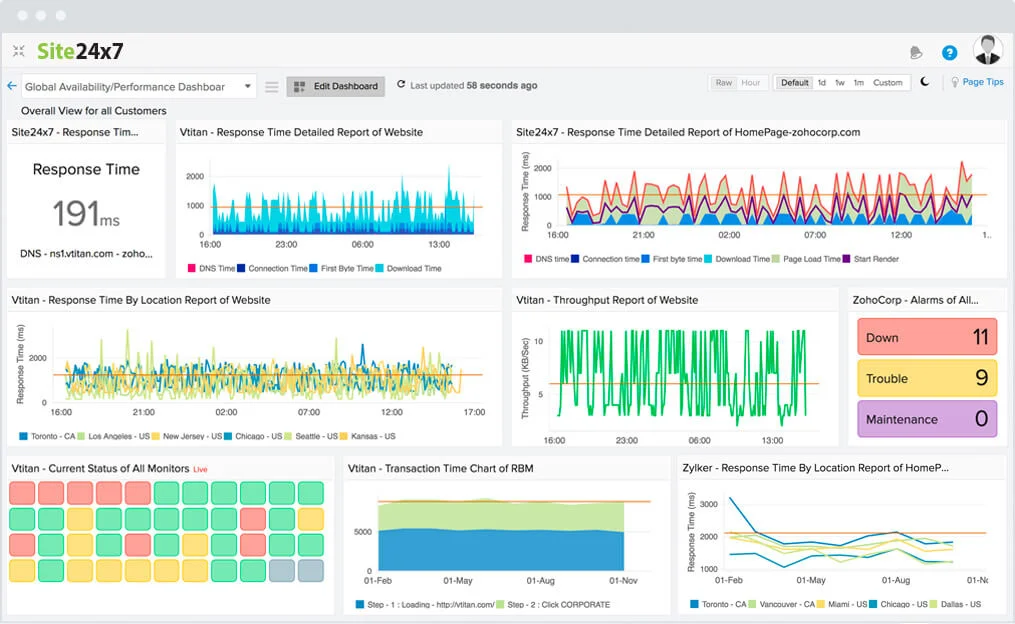
Site24x7 is a comprehensive website monitoring solution designed to ensure the optimal performance and availability of websites, servers, applications, and networks. The platform delivers automated network discovery and inventory management, coupled with the automatic generation of a network topology map.
It extends its monitoring capabilities across multiple sites and internet connections, including tracking the performance of web applications and websites.
Key Features
- Website Monitoring
- Server Monitoring
- Synthetic Web Transaction Monitoring
- Application Performance Monitoring
- Network Monitoring
- Public and Private Cloud Monitoring
- Real User Monitoring | RUM
- Cloud Cost Management
- Public Status Pages
- RMM for MSPs and CSPs
- Log Management from the Cloud
Pros
- Monitor Web applications and websites effectively.
- Track the performance of systems hosted both on-premises and in the cloud
- Full stack observability ensures immediate identification of root causes
- Ease of Use
- Integration Capabilities
Cons
- The setup of the real-time user monitor was not as functional as expected about adding 3rd party scripts.
- Takes a long time to set up everything for monitoring
- Occasional False Positives
- Costly
LogicMonitor
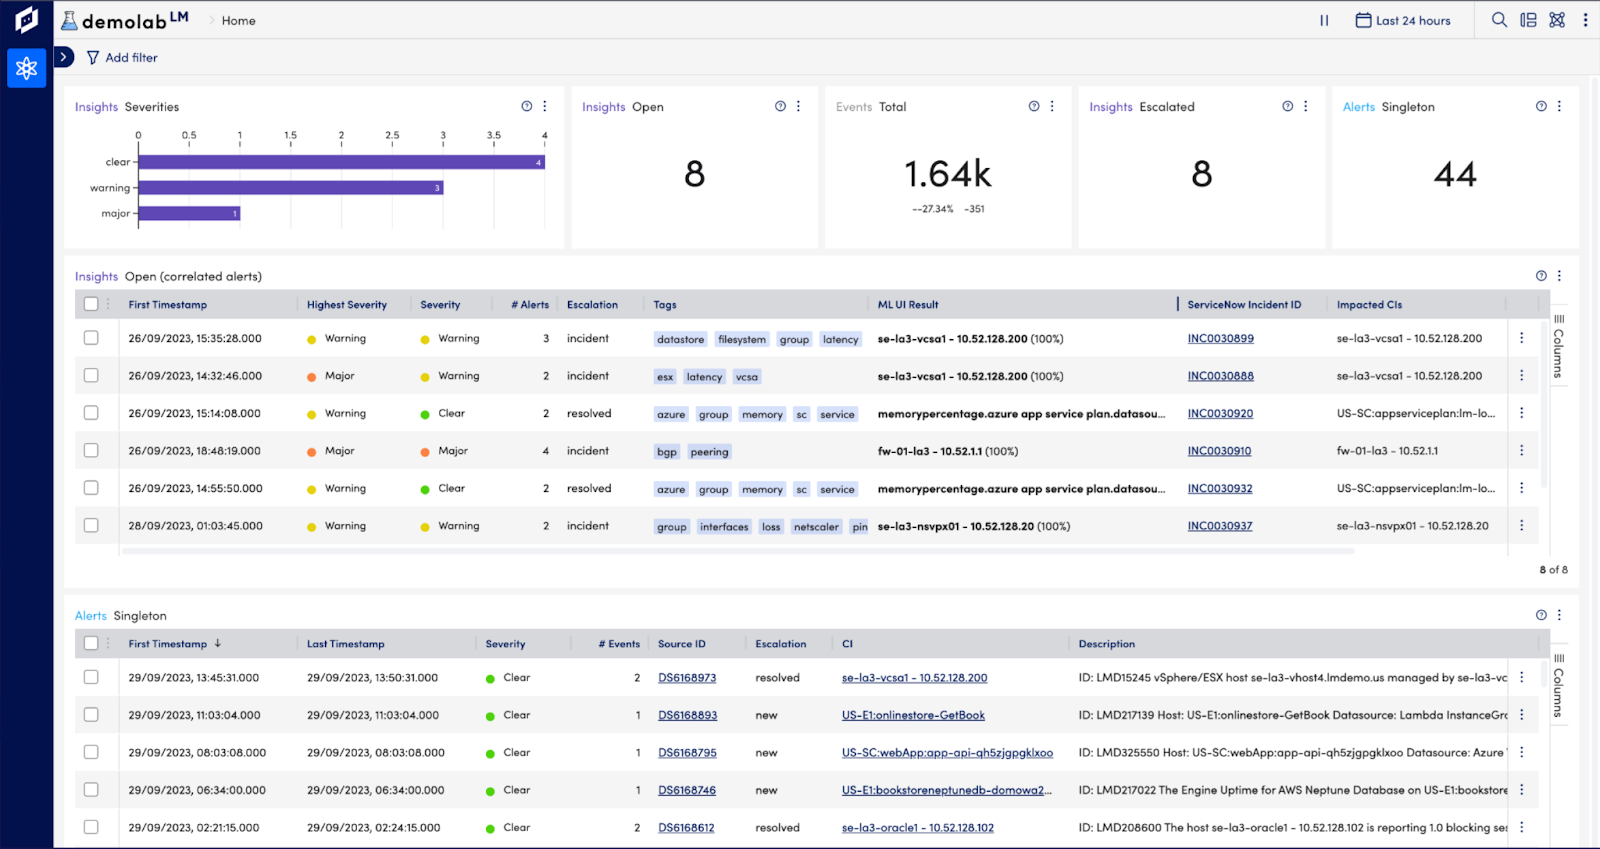
LogicMonitor presents an expansive solution, delivering log intelligence at a scale specifically tailored for hybrid and multi-cloud environments. The platform excels in centralizing, correlating, and contextualizing data, prioritizing data hygiene and internal compliance to ensure a comprehensive and compliant log management experience.
One notable feature of LogicMonitor is its capability to centralize monitoring activities, enabling users to seamlessly correlate pertinent logs with metrics within a singular platform. This integrated approach enhances the overall coherence of monitoring efforts, fostering a more holistic understanding of system performance.
Pros
- Wide range of vendor equipment supported
- Modules can be customized
- Agent or agentless monitoring
- Security features
Cons
- Changing the alerting settings is difficult
- No prebuilt alerts and templates are provided
- Customization Complexity
- Expensive
- Doesn’t provide any detailed reporting
- Mobile app not user-friendly
SolarWinds
SolarWinds stands out as a highly scalable application performance management (APM) and metrics platform designed to grow alongside your organization seamlessly. This zero-configuration APM boasts an array of features, including distributed tracing, comprehensive monitoring of hosts and IT infrastructure, the flexibility of custom metrics, and seamless integration with numerous third-party tools. All these components seamlessly contribute to a unified dashboarding, analytics, and alerting system, providing a comprehensive and holistic approach to application performance monitoring.
It offers you the features of creating a dashboard and visualizing your data. You can easily manipulate individual charts by dragging them around and adjusting their resize corners on a grid-based dashboard.
Pros
- Review Events to find out what is going on in your environment.
- Overview of syslogs or SNMP traps.
- Get alerts about issues in your environment.
- Generate reports to present the status of the monitored environment.
- Review Performance Analysis dashboards, also known as PerfStack™.
- View monitored objects on Intelligent Maps in the SolarWinds Platform Web Console
Cons
- Configuring and scripting some of the advanced features can be confusing
- Limited 3rd party compatibility
- Difficulty in modifying thresholds
- Confusing UI
- A very complex interface for network mapping feature
- Dashboard delays to show the current status of Nodes/Service
- The caching of web console requests operates at a relatively slow pace
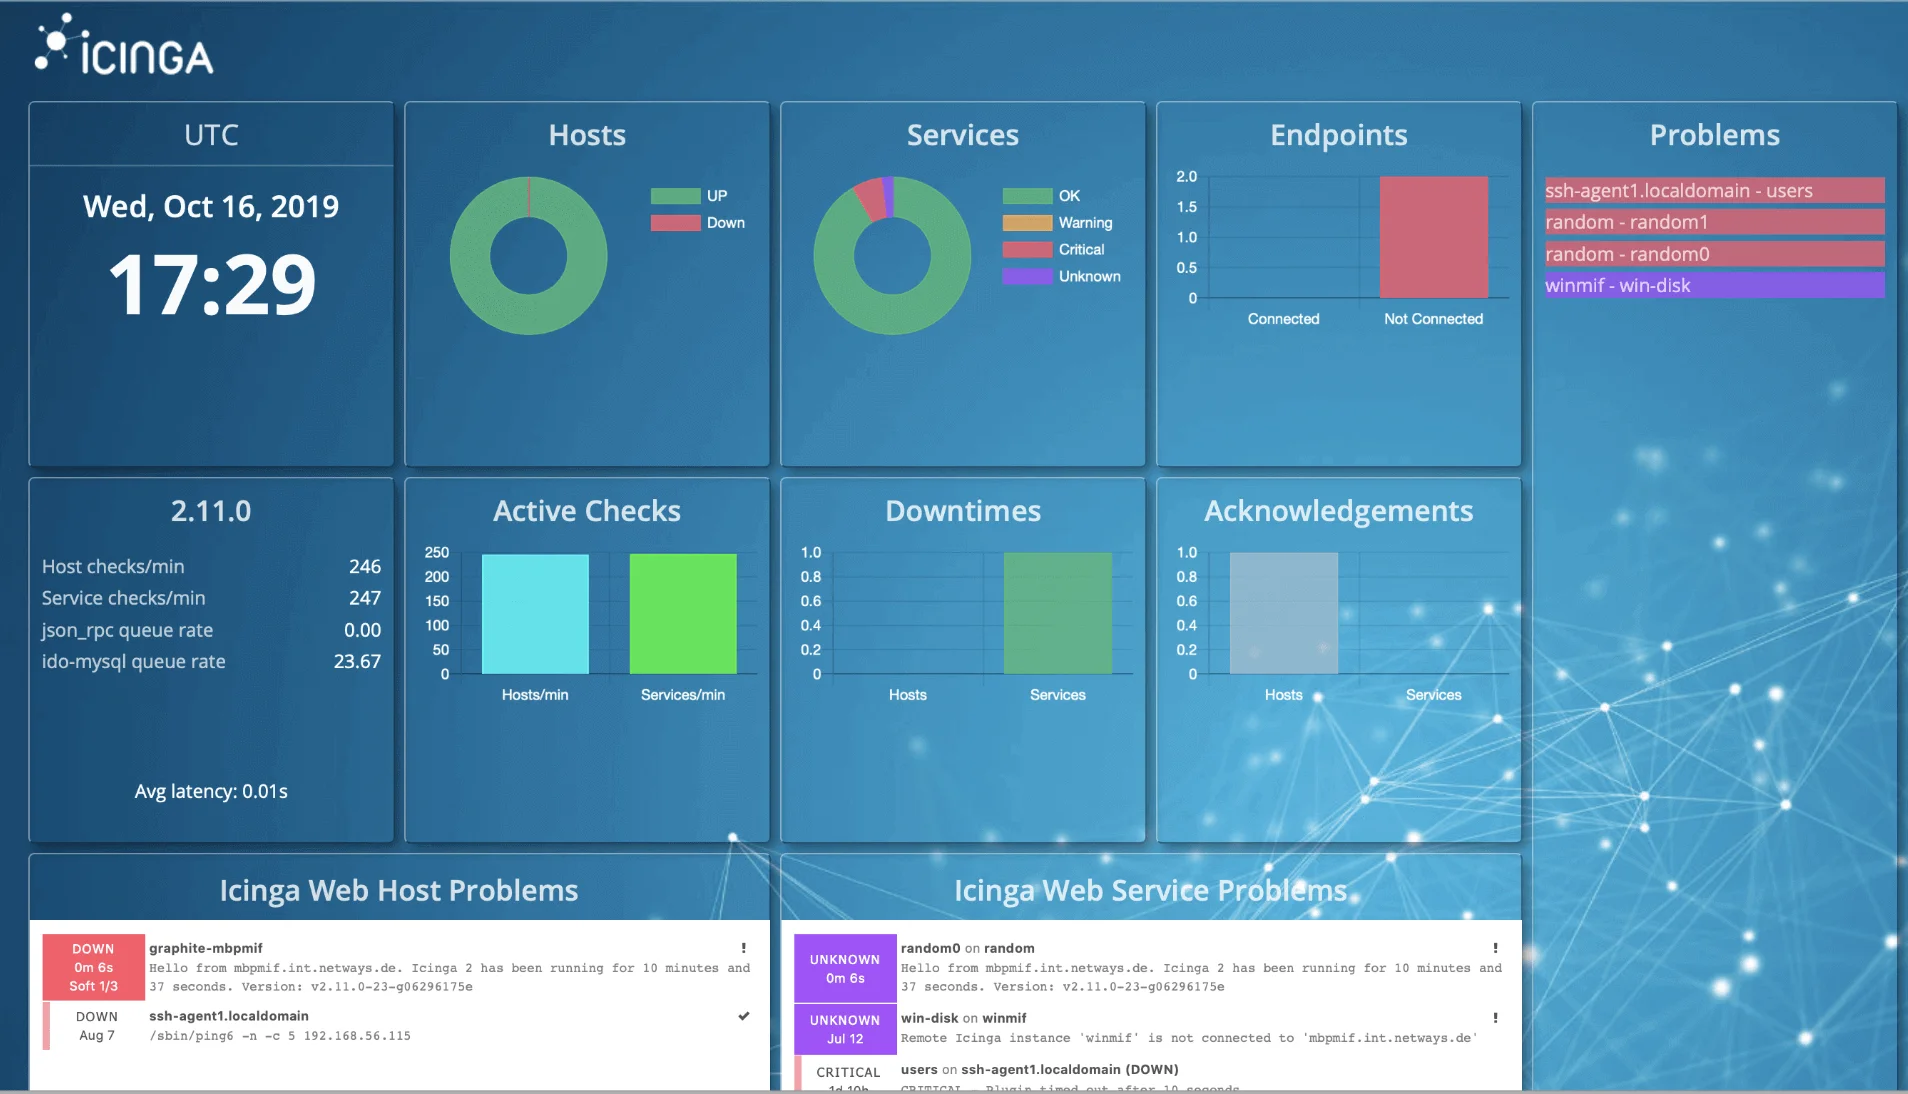
ICINGA
Icinga, an open-source network monitoring tool, delivers adaptable and scalable solutions for monitoring network resources, notifying users of outages, and supplying data for reporting purposes. Renowned for its extensible architecture, Icinga is an ideal choice for environments seeking a monitoring solution that is both customizable and scalable to their specific needs.
Its capability to seamlessly adapt to the expansion of an organization’s network and its capacity to integrate with a plethora of plugins and add-ons for enhanced functionality showcase its versatility.
Key Features
- Real-Time Network Monitoring: Icinga excels in real-time network monitoring, providing instant insights into the health and performance of critical network resources.
- Customizable Reporting: Tailor your reporting to meet specific needs with Icinga’s customizable reporting capabilities, providing in-depth insights into network performance and trends.
- Puppet Integration for Automation: Strengthen your network monitoring capabilities with integrations like Puppet for IT automation, enabling automated responses to identified issues and streamlining operational workflows.
Pros
- Open-source and Cost-effective
- Highly Flexible and Customizable
- Alerting and Reporting:
- Active Community and Support
- Lightweight and Scalable
Cons
- Initial Setup Complexity
- Documentation could be improved
- Interface can feel outdated
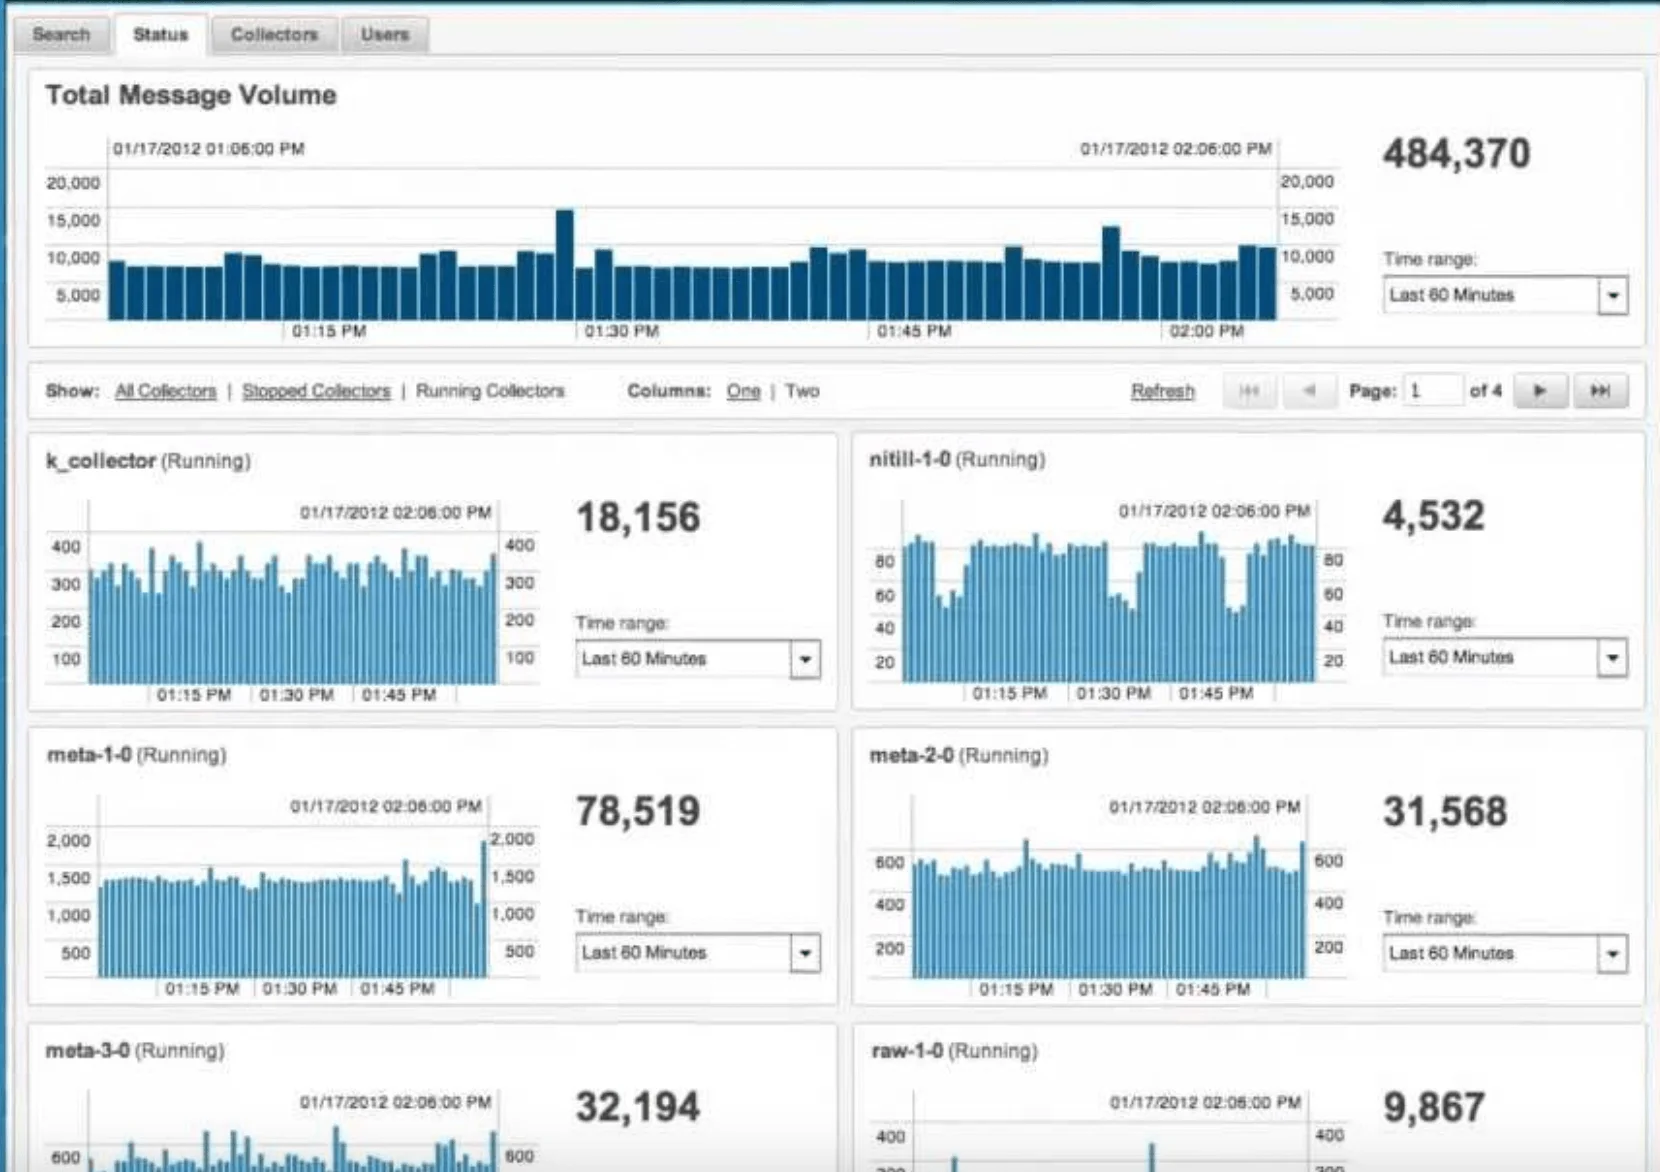
Sumo Logic
Sumo Logic is a cloud-native platform that offers comprehensive log management and observability solutions. It empowers organizations to centralize, analyze, and visualize data from diverse sources, including applications, infrastructure, and security systems, providing valuable insights for informed decision-making.
Its unified platform, real-time capabilities, and advanced analytics make it an attractive choice for organizations seeking to gain deeper insights from their data and optimize their operations. However, carefully consider the potential cost, learning curve, and resource requirements before choosing Sumo Logic to ensure it aligns with your budget and technical expertise.
Key Features
- Log management
- Infrastructure Monitoring
- Application Observability
- AWS Monitoring
- Kubernetes Monitoring
- Threat detection
- PCI compliance
- Security data lake
Pros
- Provides a single source of truth for all your log data, simplifying management and analysis.
- Uncover hidden insights and trends with powerful search and analysis capabilities.
- Delivers robust security features for threat detection and incident response.
- Offers a limited free plan for basic log management.
Cons
- Paid plans can be expensive for larger organizations with high data volumes.
- Setting up and configuring advanced features might require some technical expertise.
- The mobile app offers a less comprehensive experience compared to the web interface
Wrapping Up
Choosing the best Observium alternatives requires a thorough assessment of your unique requirements and how well they match the features provided by different monitoring solutions.
After conducting thorough research and rigorous testing, UptimeMonster has proven itself as the premier substitute for Observium. It encompasses all the vital features essential for smooth project management, presenting a cost-effective solution that is especially advantageous for startups and small teams.