

8 Best Prometheus Alternative in 2024
![]() 11 Mins Read
11 Mins Read
Are you looking for the best Prometheus Alternative?
Originally developed by SoundCloud in 2012, Prometheus has evolved into a widely adopted open-source solution for metrics and alerting. Its popularity has surged over the years, with GitHub data indicating usage by over 1,700 companies and contributions from more than 700 individual contributors.
Prometheus serves as an accessible entry point for organizations seeking to gather metrics and set up alerts. It is particularly favored by companies operating workloads on Kubernetes. While Prometheus is often self-hosted, it also offers managed options through major cloud providers such as Amazon Web Services (AWS) and Google Cloud Platform (GCP).
Limitations and Challenges of Prometheus
- Prometheus is not designed to handle logging data. While metrics and logs are both essential components of a system, users will need to rely on separate logging systems to manage log data effectively.
- Using Prometheus as a long-term storage solution for analyzing data over extended periods is not recommended. It is not designed for this purpose and may not perform optimally for such use cases.
- Although Prometheus provides visualization capabilities, it is not a comprehensive dashboard solution. Users may need to integrate it with other tools like Grafana to create customized dashboards tailored to their specific needs.
- Scaling Prometheus to handle large volumes of data across numerous machines and containers can be challenging. Users may encounter scalability issues, complex queries, and difficulties in data retrieval as the project scope expands.
- Some projects lack Prometheus plug-ins, making it challenging for developers to write exporters that collect metrics and develop converters. This limitation can hinder the integration and utilization of Prometheus in certain environments.
Best Prometheus Alternative
UptimeMonster
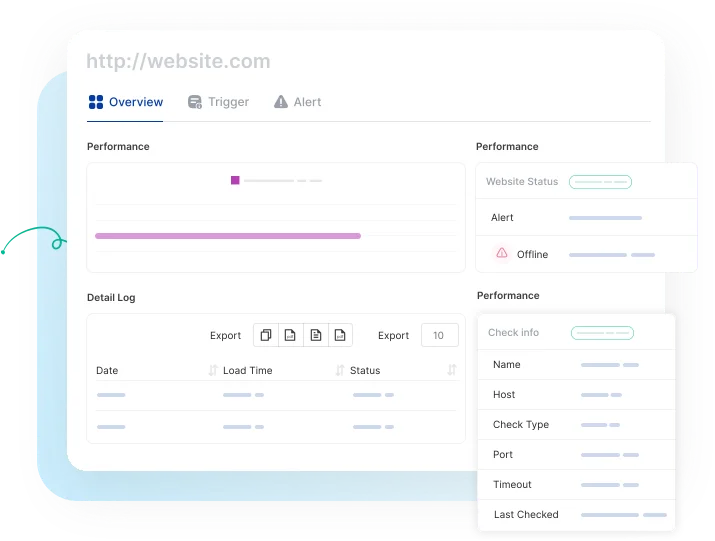
Reliable website and server monitoring service from the cloud to monitor your web availability, performance, and security. The tool will give you a 24/7 website monitoring service that will Monitor the availability of your website, APIs, and business-critical web transactions with powerful synthetic monitoring and testing tools.
It collects, correlates, and monitors servers alongside data from the rest of your stack. UptimeMonster server monitoring allows you to visualize, analyze, and track down different query metrics happening on your server so that you can prevent them before anything goes wrong.
Monitor your network performance like IP, DNS, Service port, Application, and others using the check monitoring tools. It will enable you to understand the network behavior and track NetFlow.
UptimeMonster check monitoring service will give you full control over your network. The check monitoring types are as follows
- TCP (Transmission Control Protocol)
- ICMP PING (Internet Control Message Protocol)
- IP Blacklist
- UDP (User Datagram Protocol)
- DNS (Domain Name Server)
- Application Monitoring
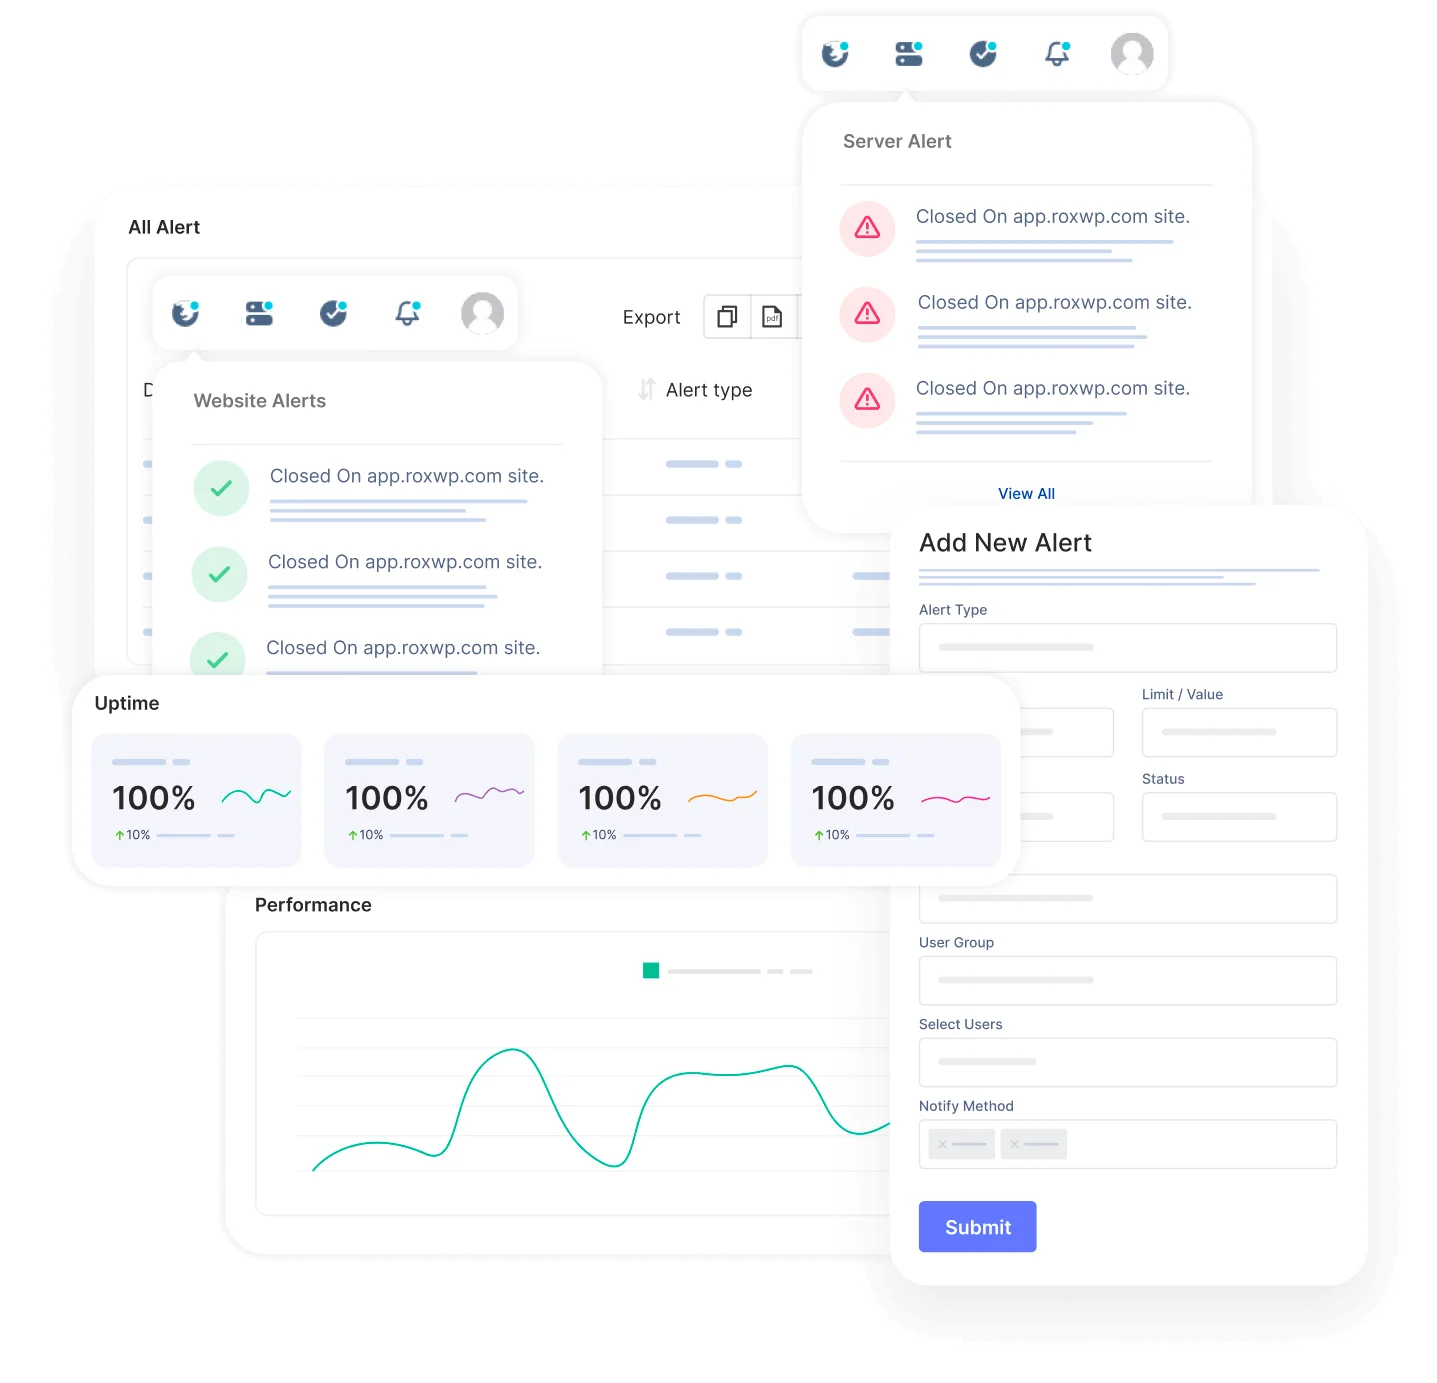
With a status page, you can share your monitoring activities and incidents with customers. You can easily make our status page public or private. You can highly customize your status page and share it with your customers to reduce the number of customer support tickets.
Using the status page you can easily gain trust from your customers. The alert notification easily notifies your customers about any incidents so that they can take necessary steps to prevent the issue. So that they will always be prepared and stay tuned.
Create and customize intricate policies for the escalation of incidents by taking into consideration various factors, including the passage of time, the availability of your team, and the source or origin of the incident.
The primary advantage, however, lies in integrated incident management and alerting. This is particularly advantageous for DevOps teams aiming to streamline their stack and potentially handle everything from a unified platform, eliminating the necessity for additional platforms.
Key Features
- Reliable Website and Server Monitoring
- Network Performance Monitoring
- Check Monitoring Types
- Status Page Customization
- Alert Notifications
- Incident Escalation Policies
- Incident Timeline
- SSL Expiration Monitoring
- Search String Monitoring
- Monitoring for HTTP(s), Ping, Port, DNS, SSL & TLD expiration, Cron jobs
- Unlimited email and push notification alerts
- Capture screenshots & error logs for incidents
Pros
- Reliable Uptime Monitoring
- Easy Setup and Configuration:
- Cost-Efficiency
- Customer Support:
- Accurate Reporting:
- User-Friendly Interface
- Customizable Alerts
- Status Page
- Escalation policies
- Incident Timeline Report
Cons
According to user reviews, UptimeMonster doesn’t exhibit any notable drawbacks. However, a few users have highlighted certain feature limitations present in the free plan offering. These limitations might include restricted access to certain functionalities or reduced capabilities compared to the premium plans. Despite this, the overall consensus from users is overwhelmingly positive regarding the platform’s performance and functionality.
Our perspective on this matter revolves around the notion that smaller teams might not necessitate the utilization of numerous advanced features. Therefore, it appears reasonable to curtail access to certain functionalities, considering that smaller teams might not require or fully utilize these advanced features. This approach ensures a streamlined and more focused user experience, optimizing the platform’s usability for smaller teams with specific needs.
Pricing
- Standard plan at $7/month with 30 monitors and 2-minute interval
- Professional plan at $19/month with 50 monitors and 1-minute interval
- Business plan at $99/month with 100 monitors and 25-second interval
InfluxDB with Kapacitor
Kapacitor serves as a native data processing engine tailored for InfluxDB 1.0 seamlessly integrated within the InfluxDB 2.0 platform.
Capable of handling both stream and batch data from InfluxDB, Kapacitor operates on this data in real-time, leveraging its programming language, TICKscript.
Primarily designed for real-time streaming data processing, Kapacitor can be deployed across infrastructure in various roles. It functions as a pre-processor, enabling downsampling and advanced analytics before forwarding data to InfluxDB. Additionally, it serves as a post-processor, allowing storage of older high-precision data in data stores like Hadoop for further analysis.
Kapacitor offers a user-friendly experience alongside robust functionality. Its ease of use is complemented by its power, enabling scripting using lambda expressions to define data point transformations and boolean conditions that serve as filters.

Key Features
- Process both streaming data and batch data.
- Query data from InfluxDB on a schedule, and receive data via the line protocol and any other method InfluxDB supports.
- Perform any transformation currently possible in InfluxQL.
- Store transformed data back in InfluxDB.
- Add custom user-defined functions to detect anomalies
Pros
- Perfect handling of telemetry data
- Low latency, near real-time
- Scalability
- Data Reduction
- Quick start
Cons
- Query return can sometime be out of order
- Backup and recovery can only be performed for all data sets, not for subsets
- Processing large datasets might demand dedicated server resources for optimal performance
- Limited Mobile Functionality: Mobile app offerings might be less comprehensive compared to the web interface
- Dependency between Shard Configurations and Retention Periods
- Lack of Distributed Deployments in Open-Source Version:
Sensu
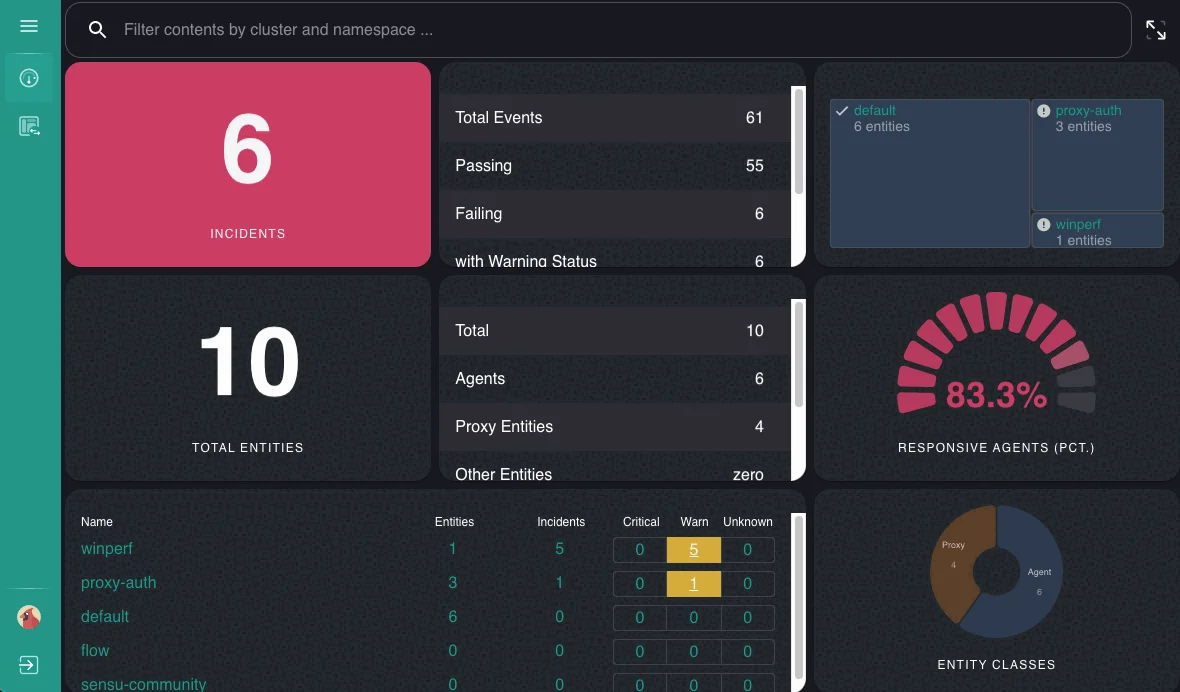
Sensu is an open-source, event-driven monitoring platform designed to help you keep your infrastructure and applications healthy. It offers a flexible and scalable approach to monitoring but does come with some trade-offs to consider.
Sensu goes beyond simple uptime checks, enabling you to collect and analyze event data from diverse sources like servers, containers, applications, and networks. It leverages plugins and checks to gather data and then routes it to handlers for further processing, alerting, and analysis.
Its flexibility, scalability, and community support make it a compelling choice for technically capable teams managing complex IT environments. However, its learning curve, complexity, and limited UI might pose challenges for smaller teams or those with less technical expertise.
Key Features
- Multi-Cloud Monitoring
- Dynamic Monitoring
- Scalability
- Flexibility
- Alerting and Notifications
- Integration
Pros
- Flexibility
- Scalability
- Dynamic Monitoring
- Integration
- Community Support
Pricing
- The Pro package starts at USD 3, per-node, per-month
- The Enterprise package starts at USD 5, per-node, per-month
Grafana
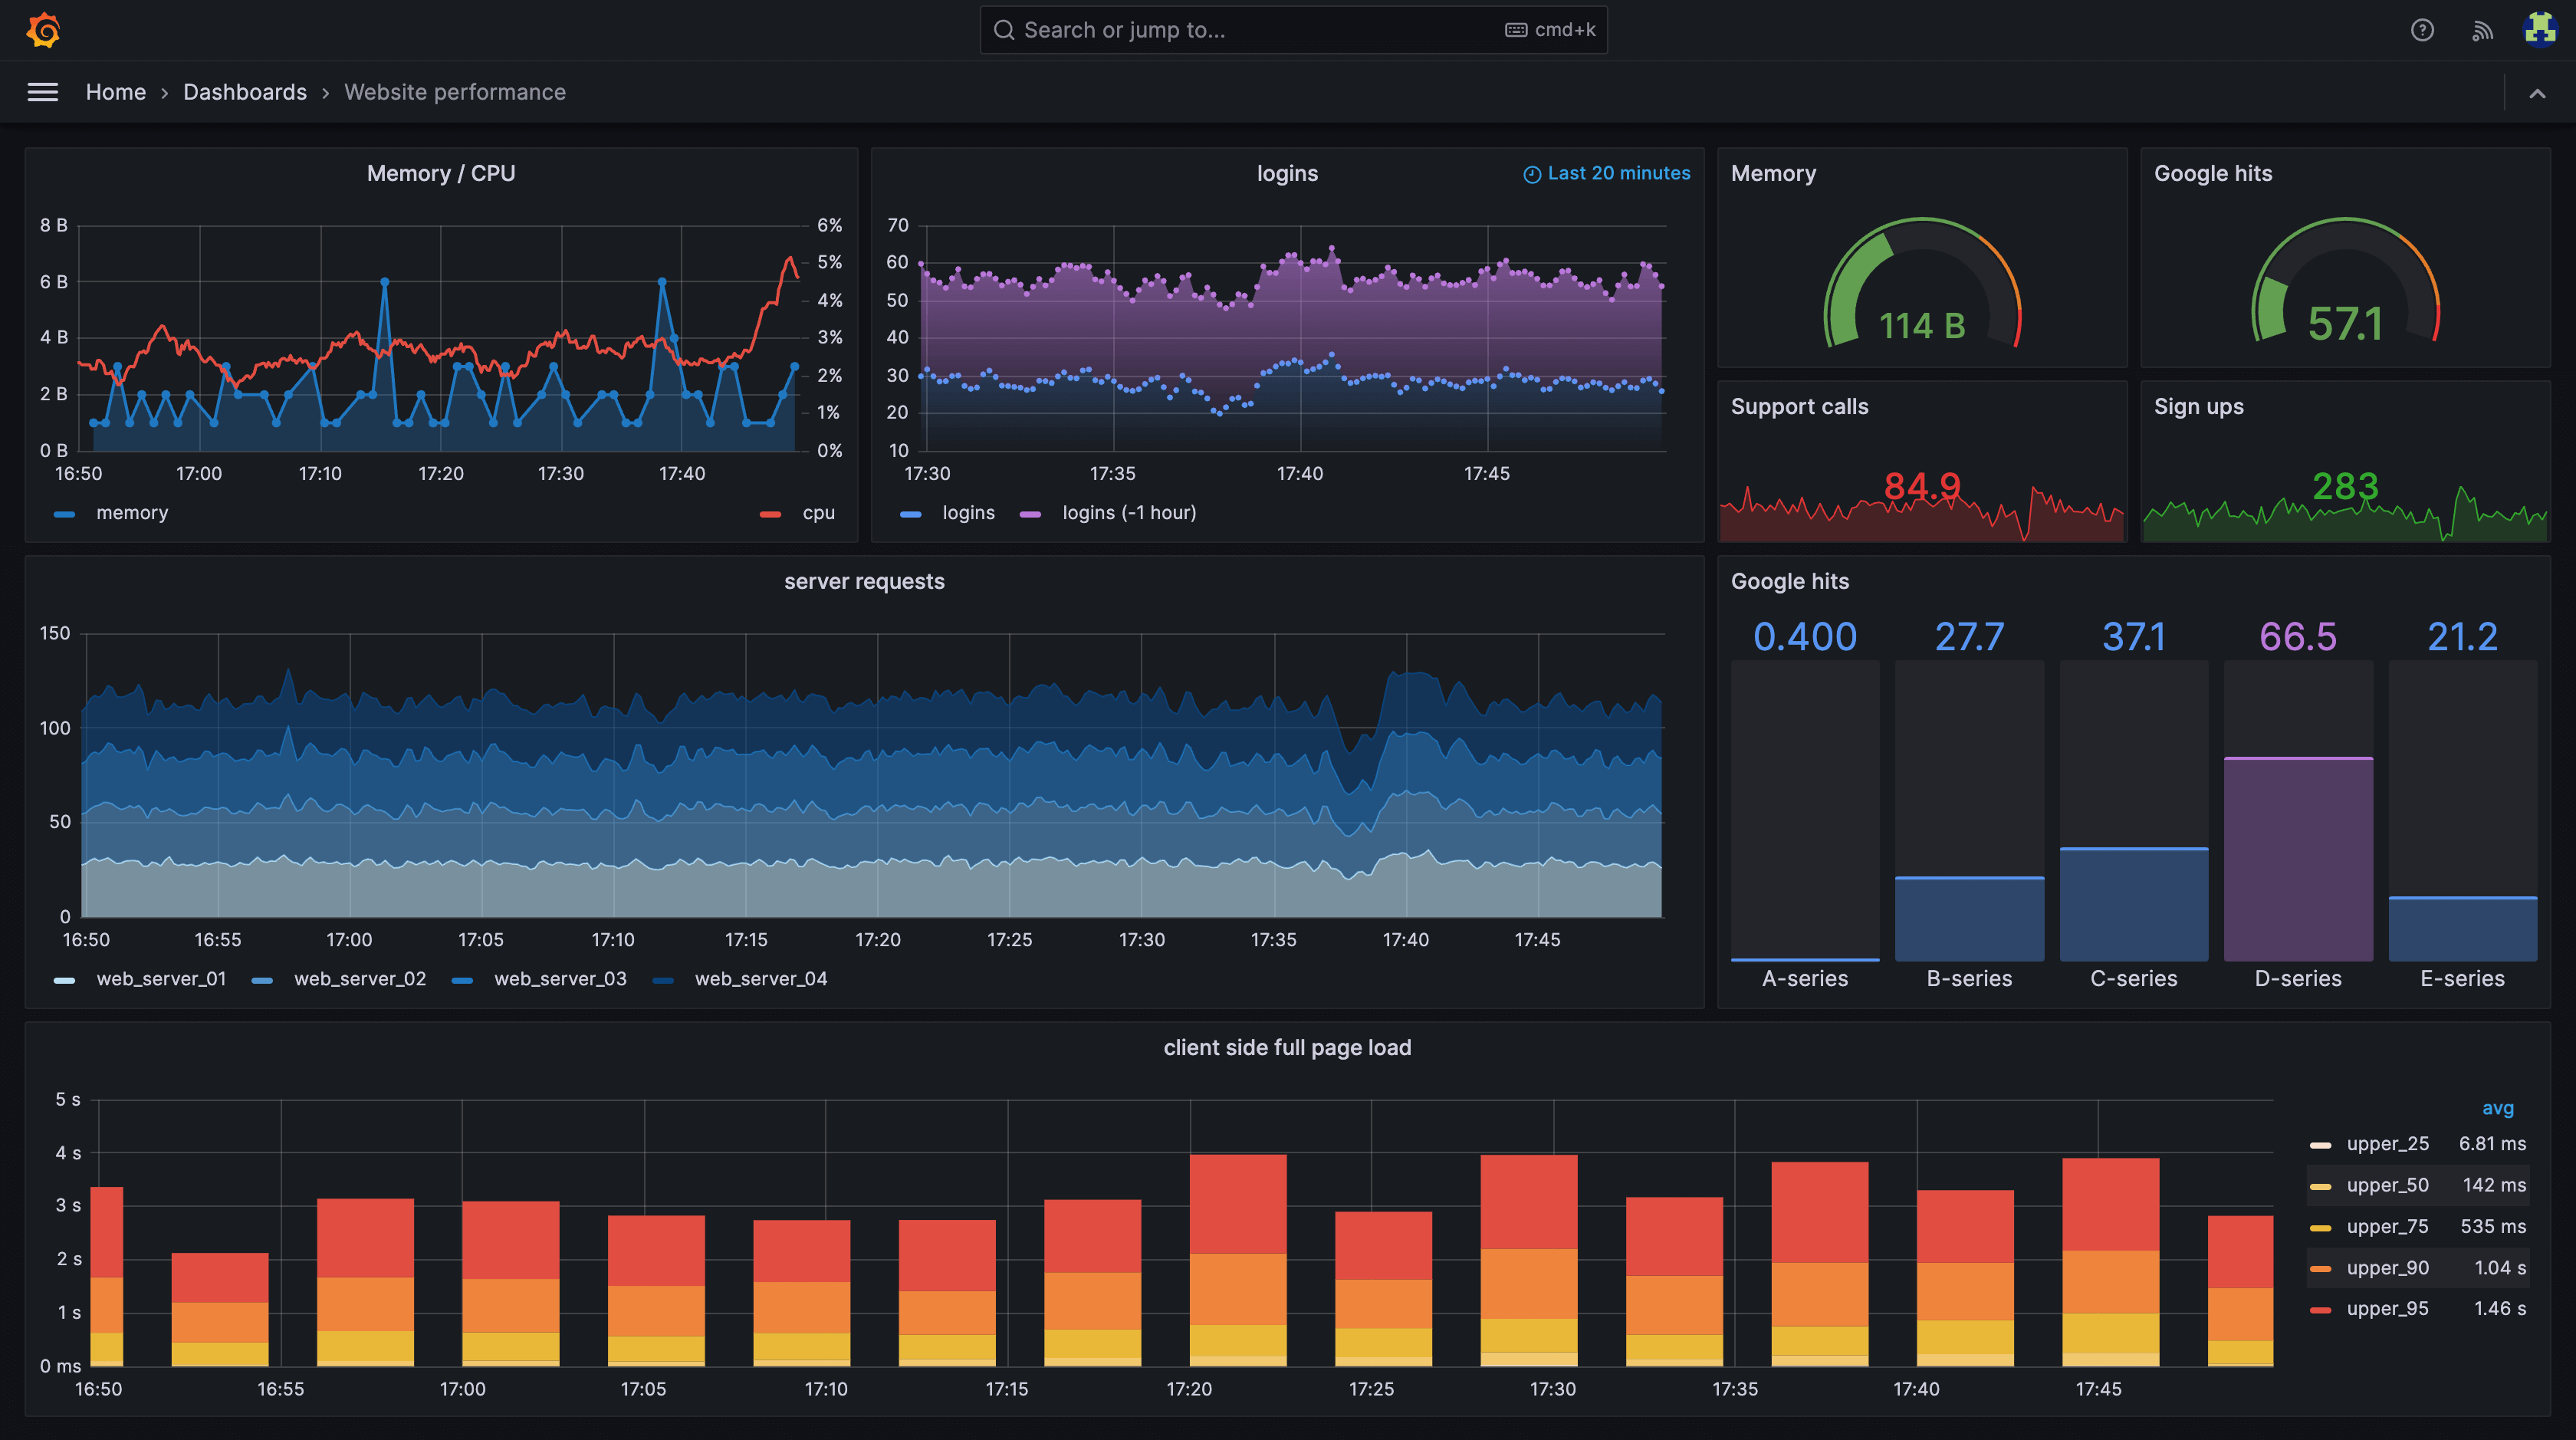
Grafana is an open-source and commercial platform that transforms raw data into captivating visuals, empowering users to understand and communicate complex information with ease. Whether you’re a developer, analyst, or business leader, Grafana offers a powerful suite of features to make sense of your data and gain actionable insights.
Grafana enables you to visualize your existing data, whether it’s sourced from your Kubernetes cluster, Raspberry Pi, various cloud services, or even Google Sheets, and present it in a customized manner on a unified dashboard.
Cons
- Documentation needs to be more clarified
- Notification alert message templates need to be simplified
- Resource-Intensive
Pricing
Grafana Advanced: Starts at $299 per user per month
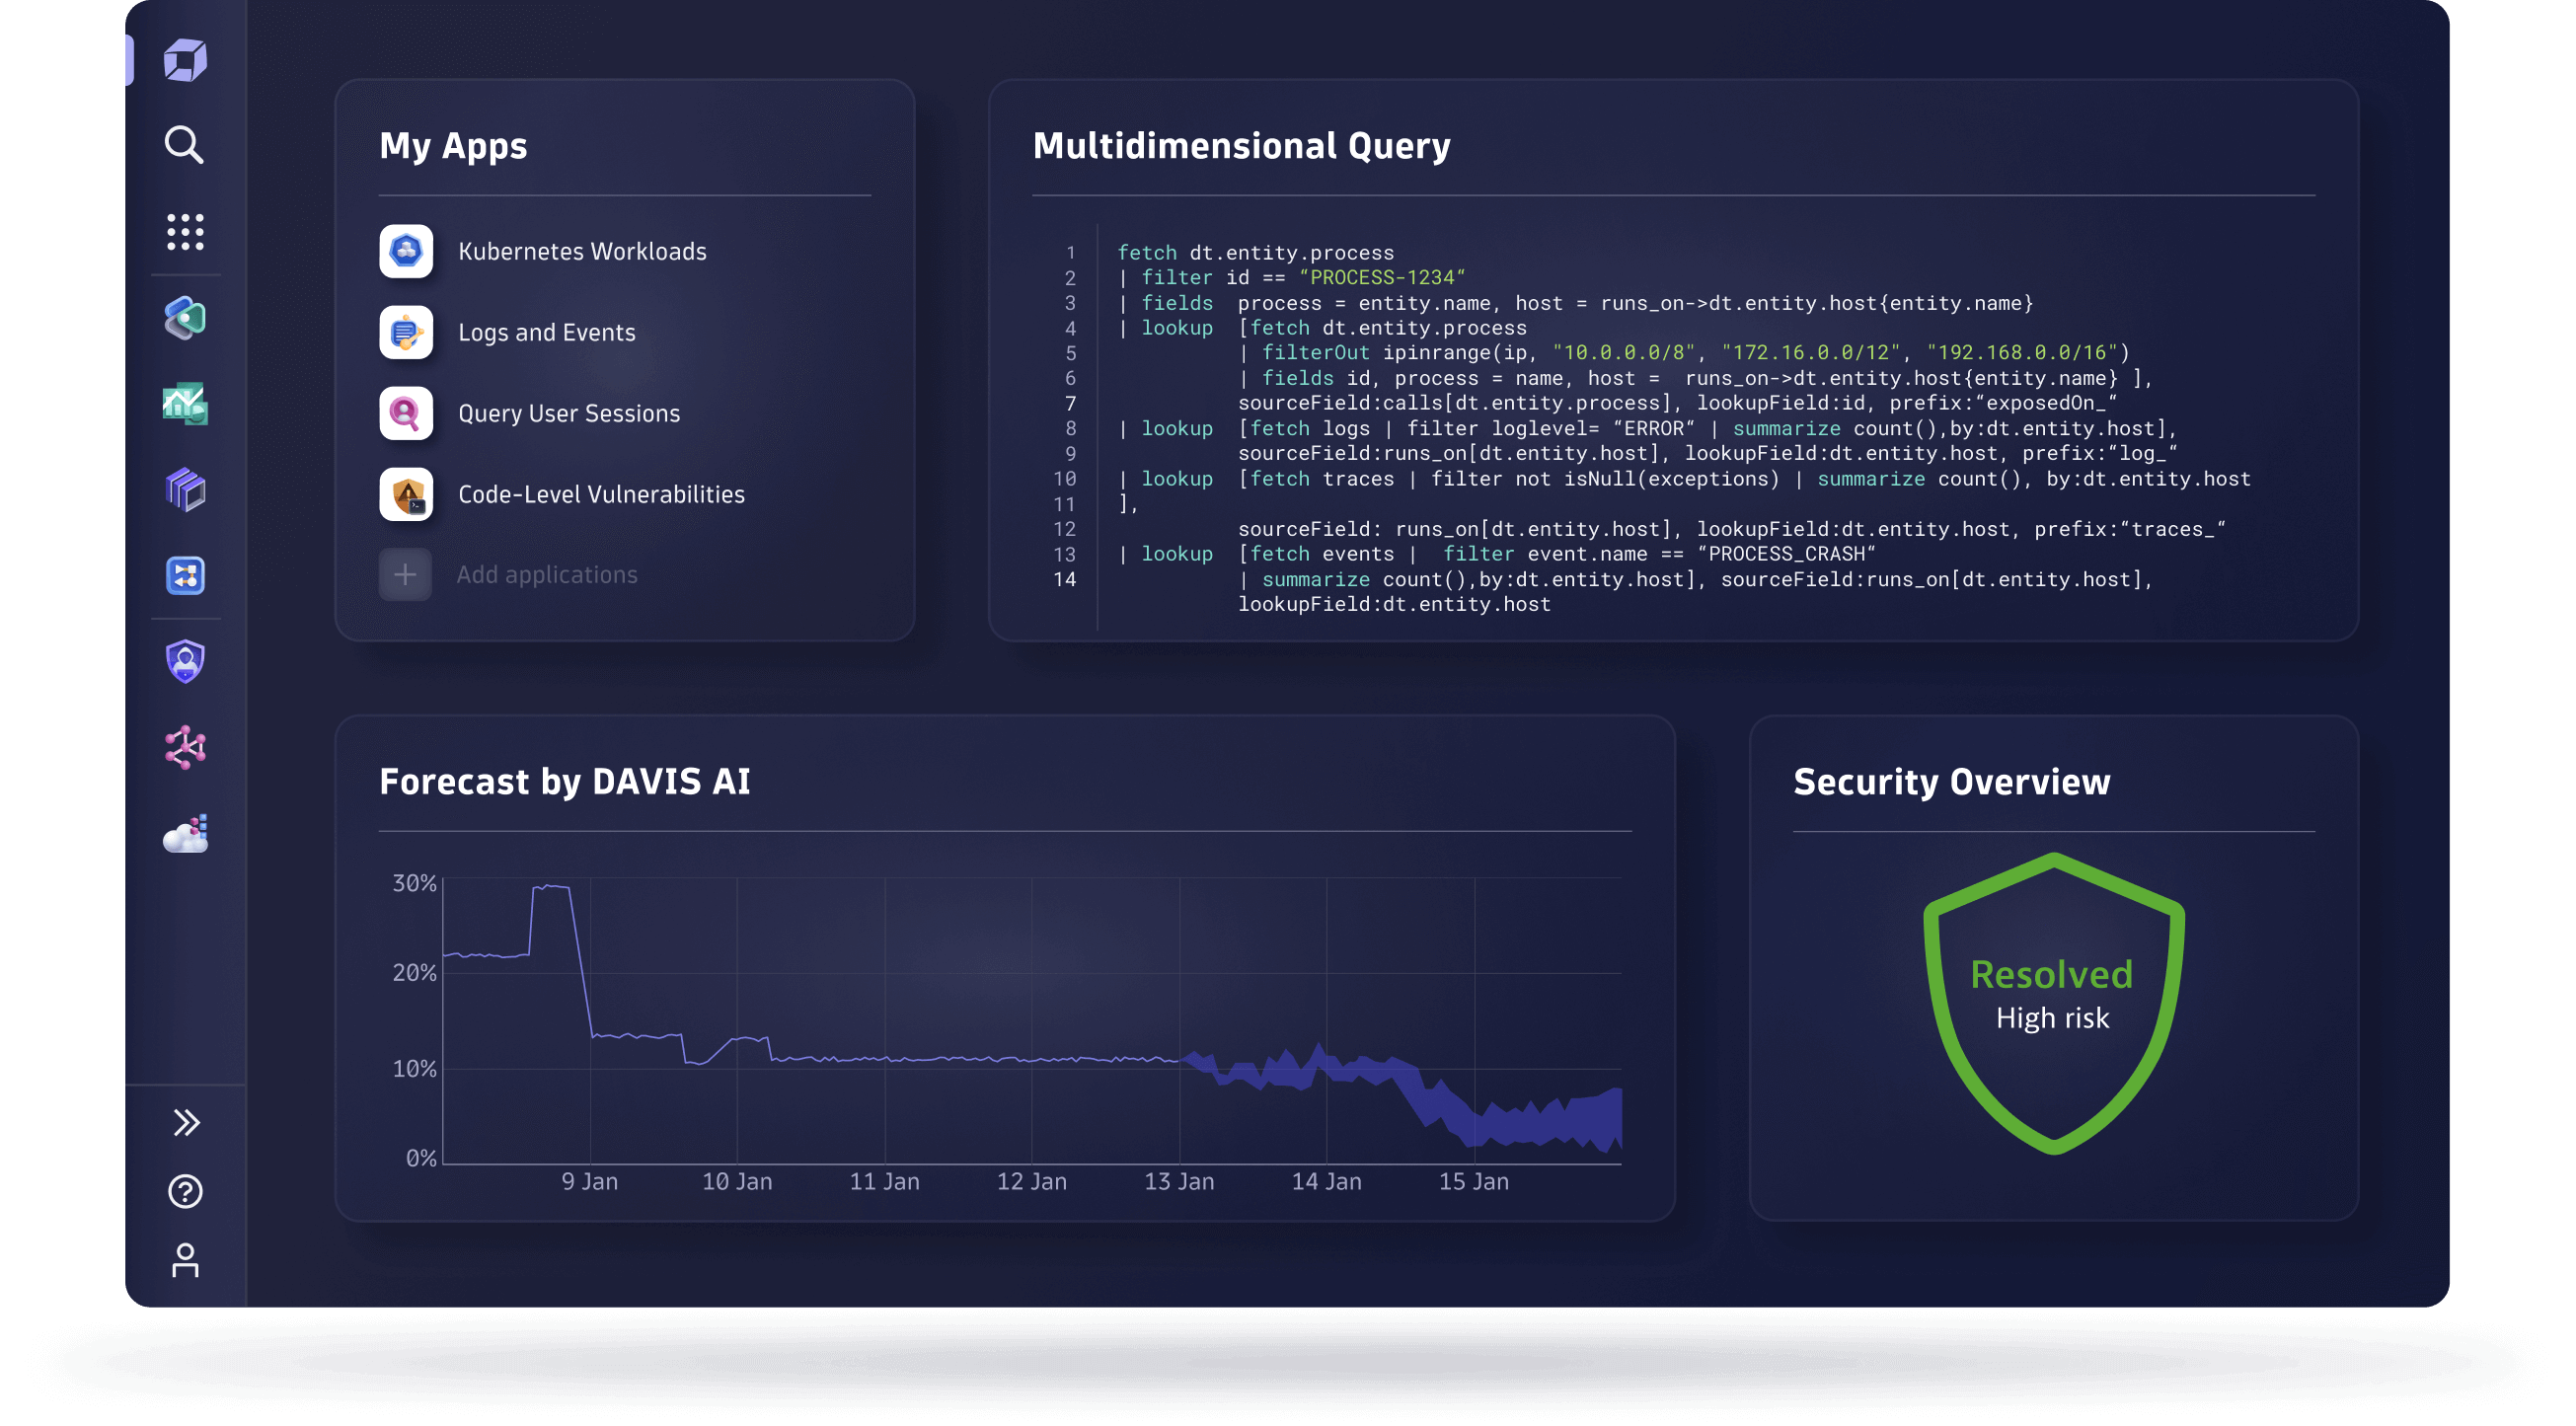
Dynatrace
Dynatrace offers two distinct products, namely Log monitoring v1 and Log monitoring v2 modes, each presenting unique approaches to log management. The v2 mode, characterized as more recent by Dynatrace, addresses issues related to logs with unrecognized timestamps and introduces a versatile log data ingestion engine. However, despite these advancements, certain features, including sensitive information masking, UI configuration files on a host, and on-demand access to log files on the monitored host, remain absent in the v2 version. It’s important to note that both versions have their strengths and limitations, and users must weigh the trade-offs based on their specific requirements.
Pros
- V1 and V2 log monitoring
- Ability to create custom synthetic monitoring workflows
- Metrics addition to the UI
- AI-driven analytics
- Monthly reports for application performance and SLAs
- Custom workflow creation
Cons
- UI can be more user-friendly
- The alerting mechanism should be improved for a smoother experience
- Lack of clear documentation and complexity
- The concept is rather intricate, making it challenging to grasp, and there’s a risk that it could become more overwhelming than beneficial for a non-technical person
- Higher pricing
- Sometimes takes a long time to identify and analyze processes
- The alert notification system fails to ascertain the urgency of an issue and whether it requires immediate attention or not.
Pricing
- Full-Stack Monitoring – $0.08
- Infrastructure Monitoring – $0.04
- Application Security – $0.18
- Application Security – $0.00225
- Synthetic Monitoring – $0.001
- Log Management & Analytics – $0.20
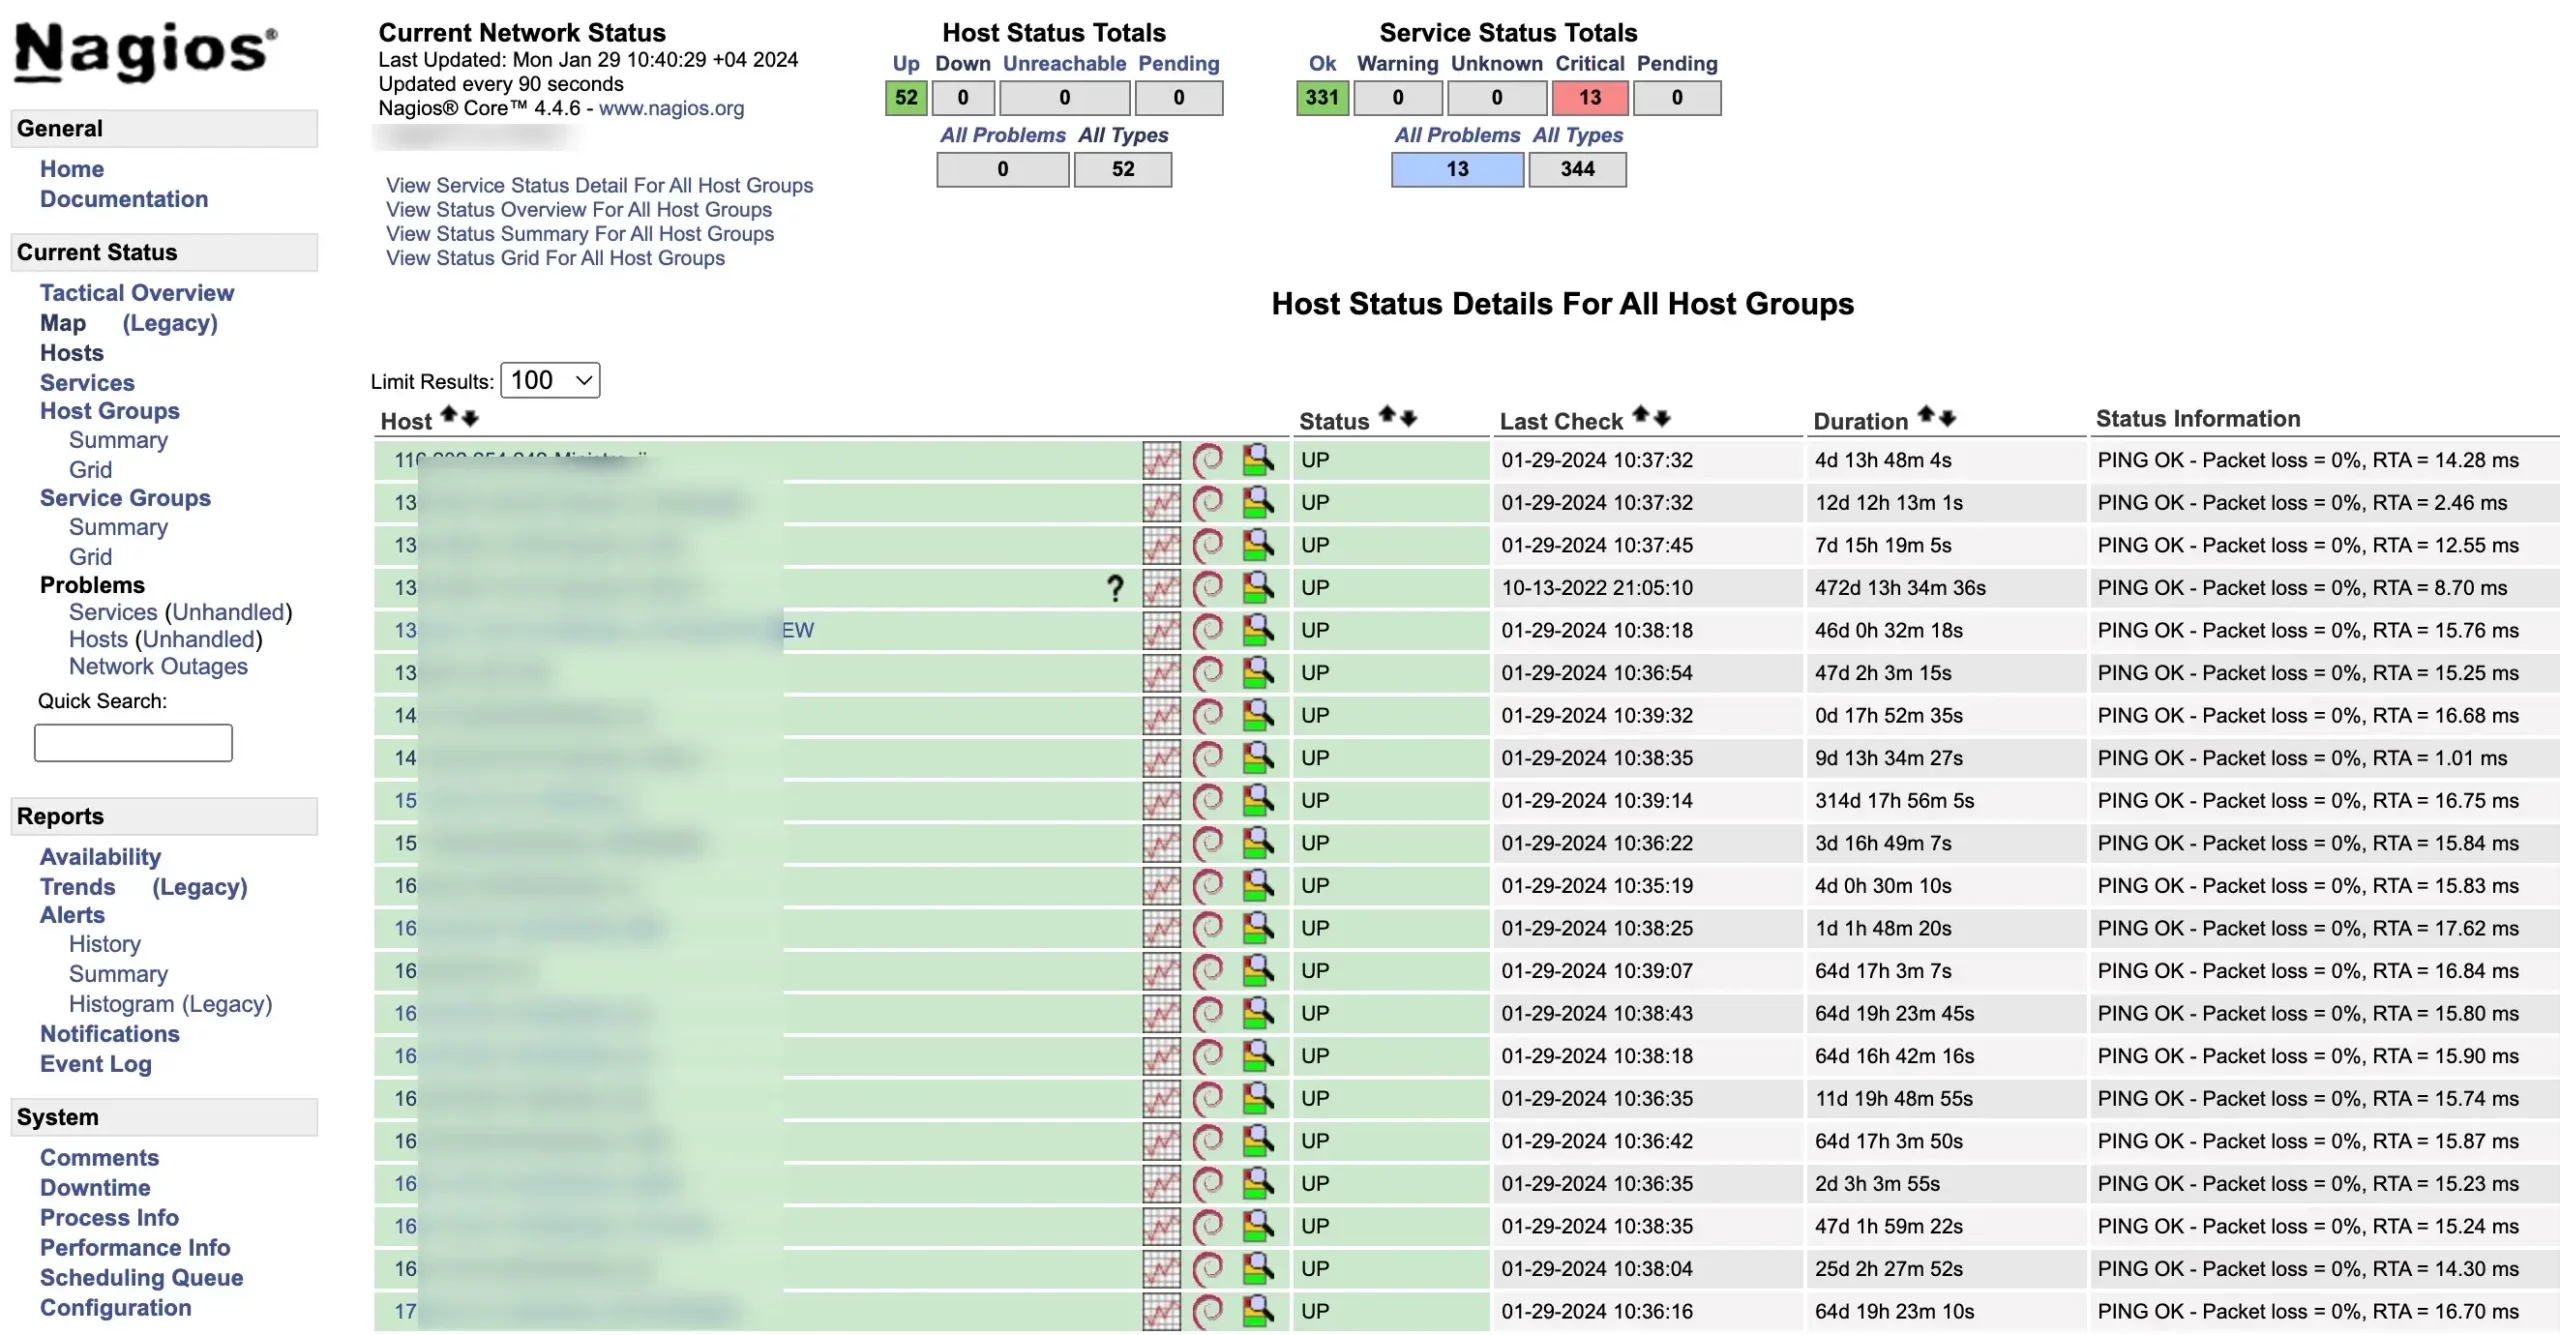
Nagios
Nagios is an open-source and commercial monitoring tool used by businesses of all sizes to keep their IT infrastructure up and running. It monitors everything from servers and networks to applications and services, alerting you to potential problems before they become critical.
Nagios XI diligently monitors various elements of your infrastructure, encompassing applications, operating systems, network architecture, network protocols, services, and system metrics. Its extensive library of hundreds of third-party addons empowers you to monitor virtually any internal or external program, service, or system with flexibility and adaptability.
Nagios Fusion unites dispersed Nagios XI and Core servers, granting panoramic network oversight and simplifying issue resolution across vast networks. Centralize diverse Nagios deployments with Fusion, boosting scalability and resolving geographically scattered network issues effortlessly.
Key Features:
- Monitoring of various IT components: Nagios can monitor servers, networks, applications, services, and more. It supports various protocols like SNMP, Ping, SSH, and WMI to collect data from different devices and systems.
- Customizable alerts and notifications: You can define custom alerts and notifications for different types of issues. Nagios can send alerts via email, SMS, instant messaging, or other channels to ensure the right people are notified promptly.
- Reporting and data analysis: Nagios provides comprehensive reports and data analysis to help you track trends, identify potential issues, and improve the performance of your IT infrastructure.
- Flexible and scalable: Nagios is highly flexible and scalable. You can start with a basic setup and add more features and functionality as your needs grow.
- Open-source and commercial options: Nagios Core is an open-source solution, while Nagios XI is a commercial version with additional features and enterprise-grade support.
Pros
- Highly customizable: Nagios can be customized to meet the specific needs of your IT infrastructure.
- Wide range of features: Nagios offers a wide range of features for monitoring different aspects of your IT environment.
- Powerful alerting system: Nagios’ alerting system ensures that you are notified of potential problems promptly.
- Active community: Nagios has a large and active community that provides support and helps you troubleshoot any issues.
- Cost-effective: Nagios Core is free to use, and Nagios XI is relatively affordable compared to other monitoring solutions
- Integration Capabilities: Nagios seamlessly integrates with various third-party tools and services, fostering compatibility and expanding its functionality according to organizational needs.
Cons
- Can be complex to set up: Nagios can be complex to set up for beginners, especially the open-source version.
- Requires technical expertise: Using and maintaining Nagios effectively requires some technical expertise.
- Limited scalability for large enterprises: The open-source version of Nagios may not be scalable enough for large enterprises.
Pricing
- The initial cost for Nagios XI begins at $1,995 per instance, billed on an annual basis.
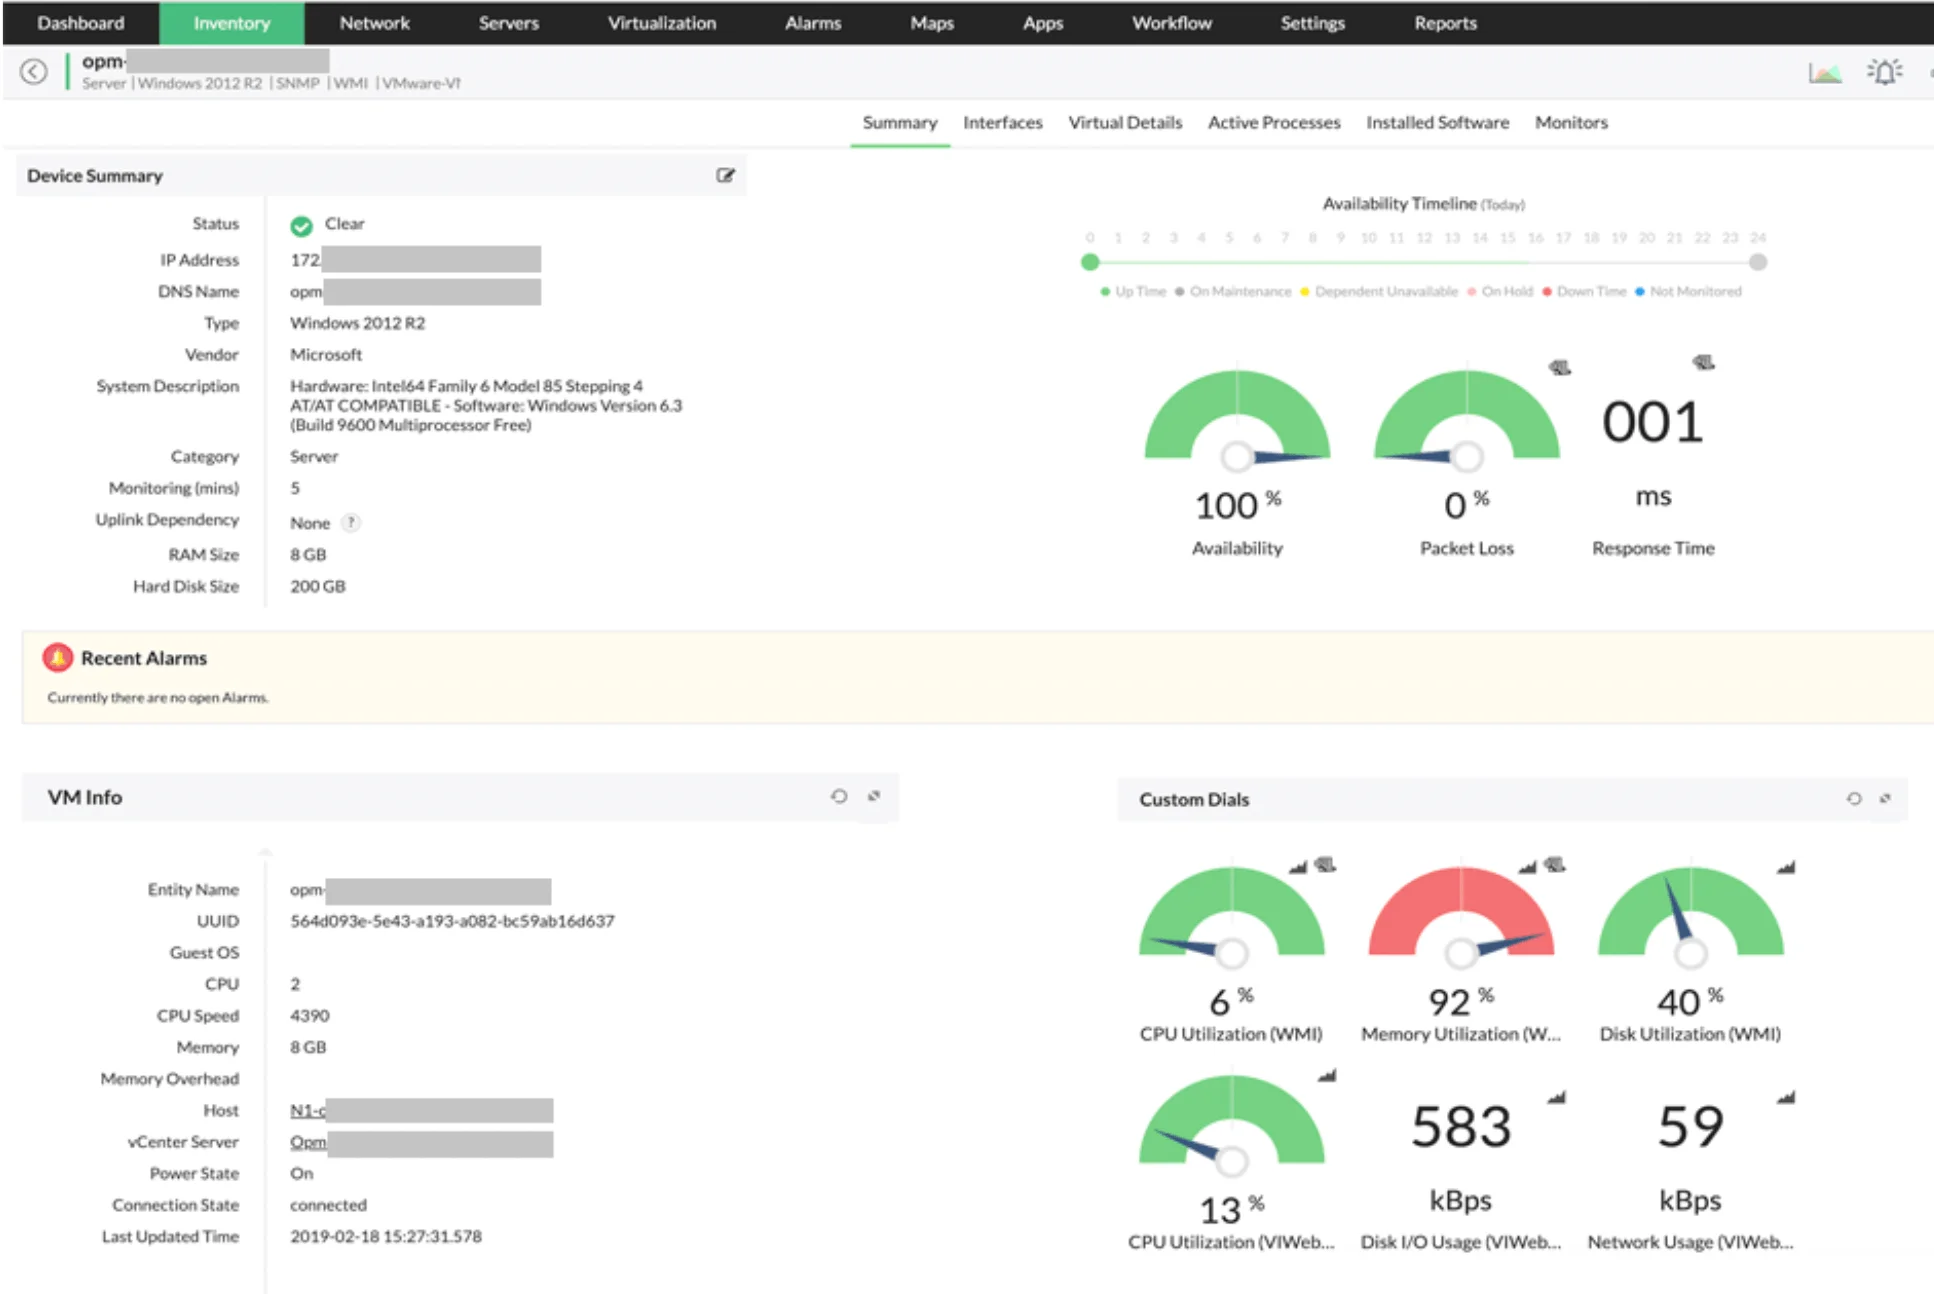
ManageEngine OpManager
ManageEngine OpManager is a powerful network monitoring software that provides deep visibility into the performance of your routers, switches, firewalls, load balancers, wireless LAN controllers, servers, VMs, printers, and storage devices. It is an easy-to-use and affordable network monitoring solution that allows you to drill down to the root cause of an issue and eliminate it.
Featuring flexible per-device pricing, OpManager enables gradual scalability beyond the Free Edition’s foundational features. Its compatibility with various operating systems and hypervisors makes it an excellent choice for managing virtual infrastructure, aligning seamlessly with your company’s long-term objectives.
Key Features
- Comprehensive Network Monitoring
- Proactive Issue Resolution
- Flexible Per-Device Pricing
- Compatibility and Virtual Infrastructure Management
- End-to-End Visibility and Analytics
- Sophisticated Autodiscovery Tools
- Integration Capabilities
Pros
- Easy to use
- Affordable
- Scalable
Cons
- Limited free edition
- Some advanced features require additional licenses
- Can be resource-intensive for large networks
Pricing
ManageEngine OpManager offers a variety of pricing plans based on the number of devices you need to monitor. The Standard Edition starts at $245 per year for 10 devices, the Professional Edition starts at $345 per year for 10 devices, and the Enterprise Edition starts at $11,545 per year for 250 devices.
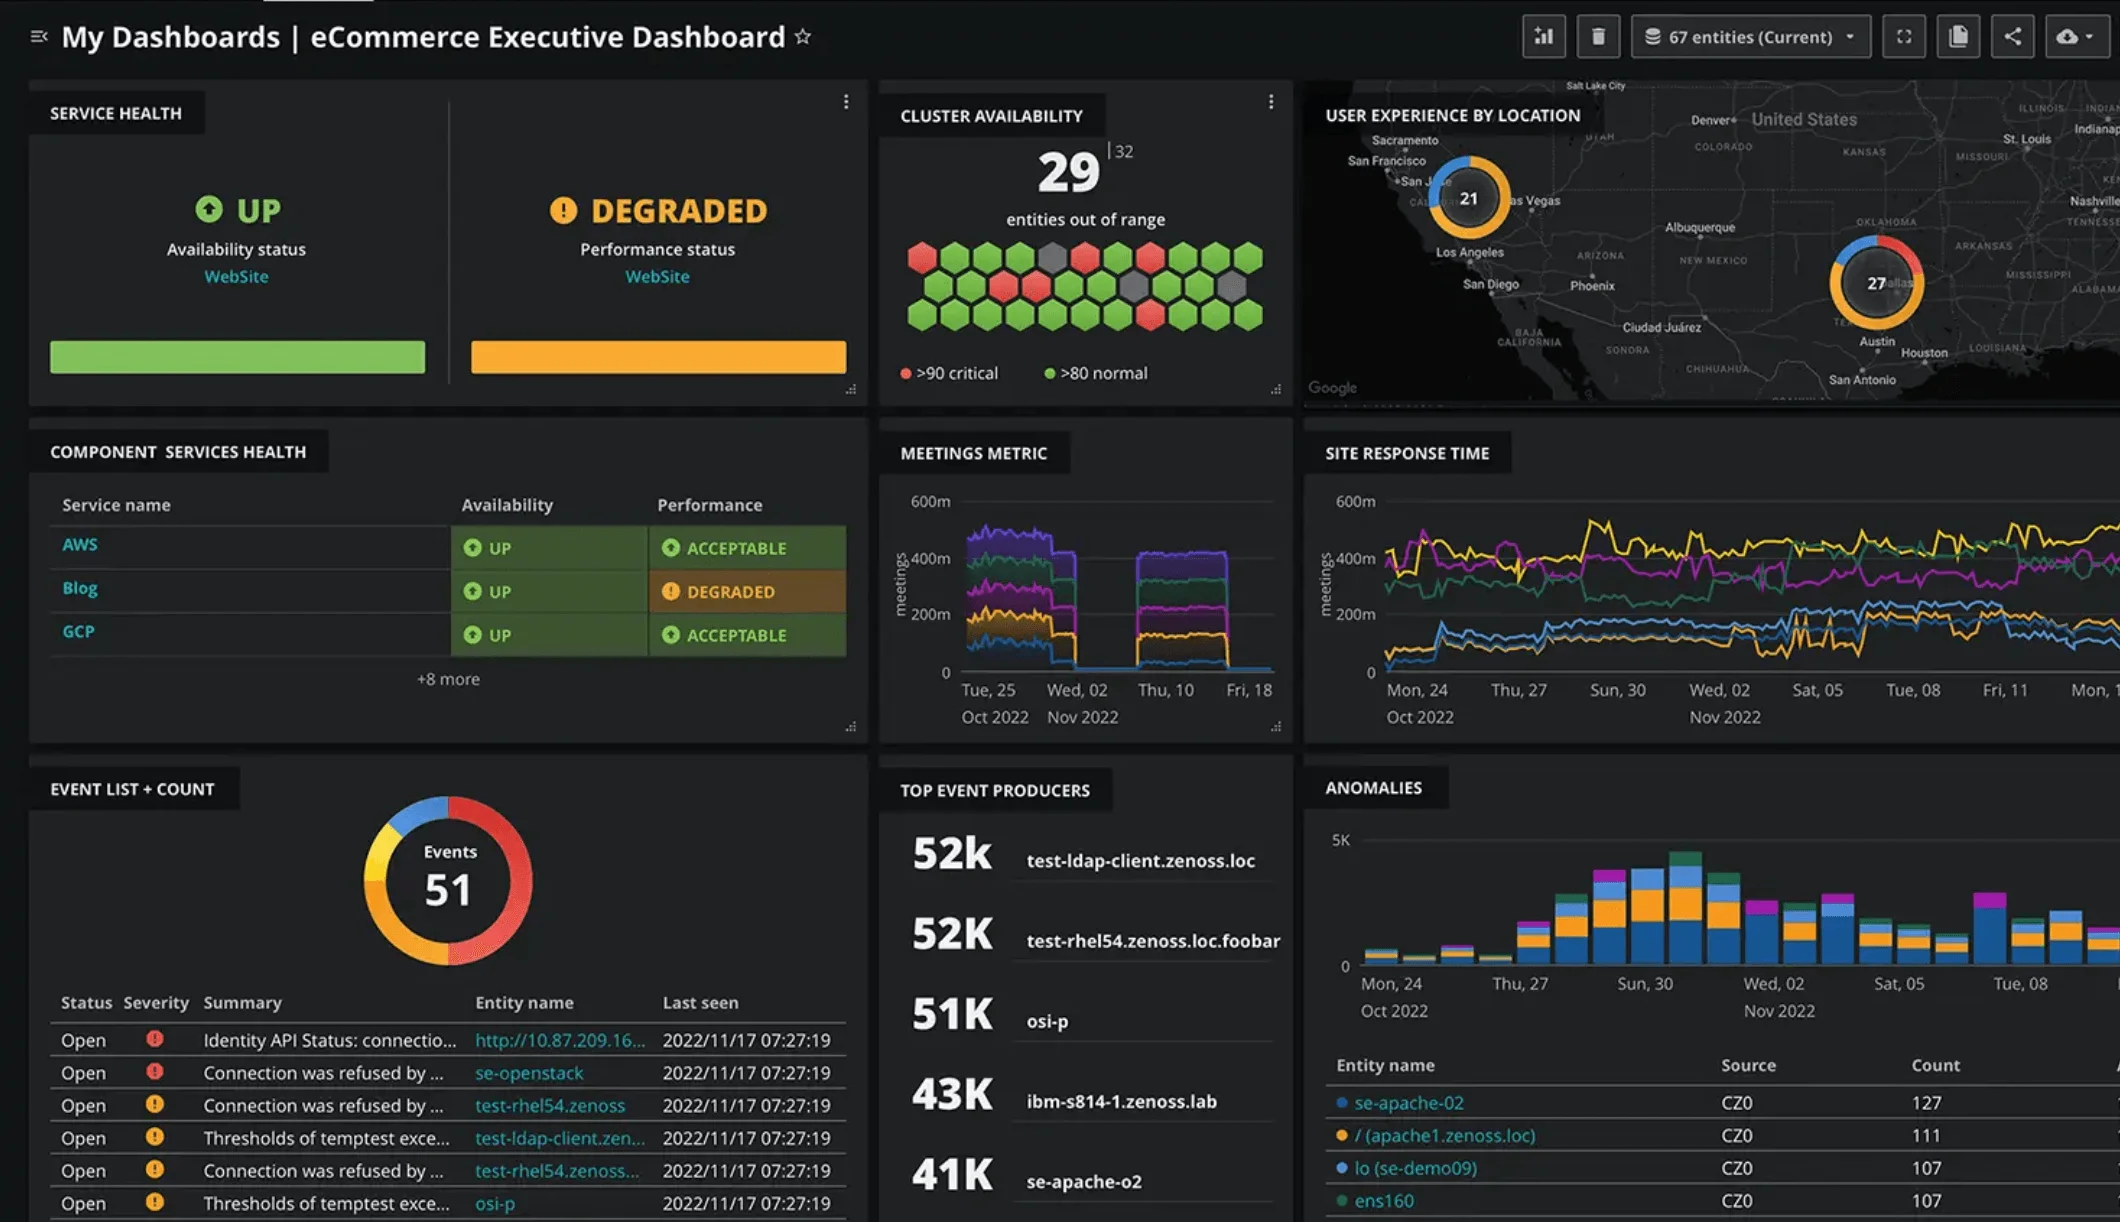
Zenoss
Zenoss is a unified monitoring platform that helps businesses of all sizes gain visibility and control over their IT infrastructure. It goes beyond simple monitoring, offering intelligent event correlation, automation, and remediation capabilities to keep your systems running smoothly.
Its remarkable scalability and holistic monitoring approach distinguish it from the rest. In my evaluation, Zenoss stands out as the “Top Choice for unified monitoring in large-scale environments,” thanks to its broad infrastructure coverage and the depth of its monitoring capabilities.
Key Features
- Real-Time Analytics: Zenoss incorporates real-time analytics, providing immediate insights into the performance and health of IT infrastructures. This enables timely decision-making and proactive issue resolution.
- Capacity Planning: The platform includes robust capacity planning tools, allowing organizations to efficiently manage and optimize their resources based on real-time data and analysis. This feature aids in ensuring optimal performance and resource utilization.
- Root Cause Analysis: Zenoss facilitates root cause analysis, helping IT teams identify and address the underlying issues causing disruptions or performance degradation. This feature enhances incident resolution efficiency.
- Extensive Integrations: Zenoss offers comprehensive integrations with various technologies, including public clouds such as AWS, Azure, and Google Cloud. It also seamlessly integrates with private cloud solutions and virtualization technologies like VMware and OpenStack.
- Cloud Integration: With native integration capabilities for leading public cloud providers, Zenoss enables organizations to monitor and manage their cloud-based resources effectively. This ensures a unified approach to monitoring across on-premises and cloud environments.
- Private Cloud and Virtualization Support: Zenoss extends its support to private cloud environments, ensuring seamless monitoring of resources within private infrastructures. Additionally, it integrates with virtualization technologies like VMware and OpenStack to provide holistic visibility.
Pros
- Extensive Range of Integrations
- Comprehensive Monitoring Features
- Scalable for Large-Scale Environment
- Increased visibility and control
Cons
- No Transparent Pricing Available
- Complex Setup and Configuration
- Perceived Complexity Compared to Similar Tools
Pricing
- Starter Edition: Up to 250 devices – $5,000 per year
- Standard Edition: Up to 1,000 devices – $10,000 per year
- Enterprise Edition: Unlimited devices – Contact Zenoss for a quote