Check Overview
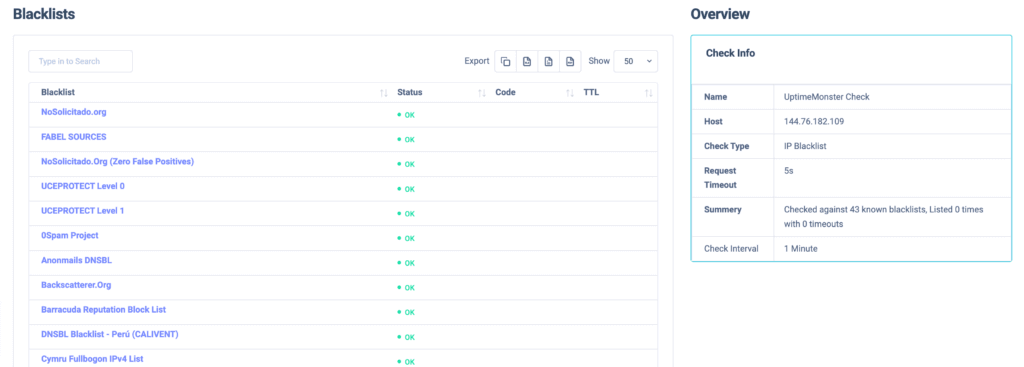
Click any of the checks to see its detailed log and performance. Based on your check type the overview will be different. For example, if you monitor a check for blacklist then it will show you the blacklist website data. On the other hand, if you monitor an FTP IP then it will show you the performance log.
Check Performance
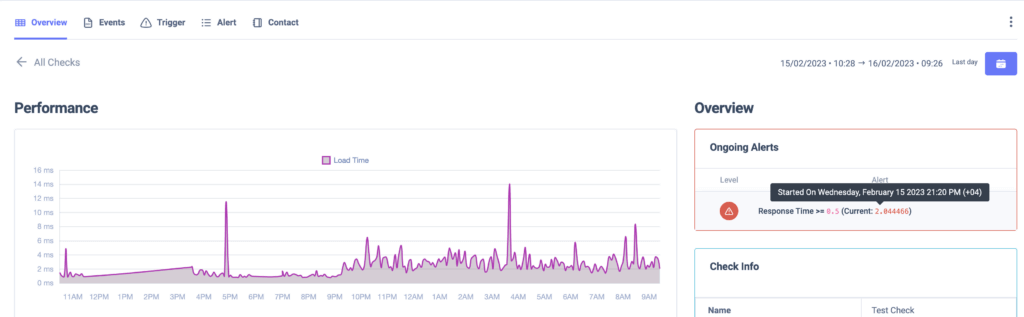
You can view your overall check performance with a detailed diagram.

Check log
Analyze the check log with the date, load time, and status and take the necessary steps.

You can filter the check data too. For example, if you need the last 30 minutes’ data or the data from the previous day, or any specific time period, you can easily get it. Our advanced filer features will provide you with the specific time data you need.
To filter the data click on the calendar icon on the right sidebar and then set the specific date and time to get the data you want to display.

If your monitor has any ongoing alerts, you can also see the alert overview here too. Just place your mouse on the alert and you can see the alert time and reason as a tooltip.
Now from the check info table, you can view the details of the check like –
- Check name
- IP
- Check Type
- Port
- Request Timeout
- Load Time
- Check intervals & others
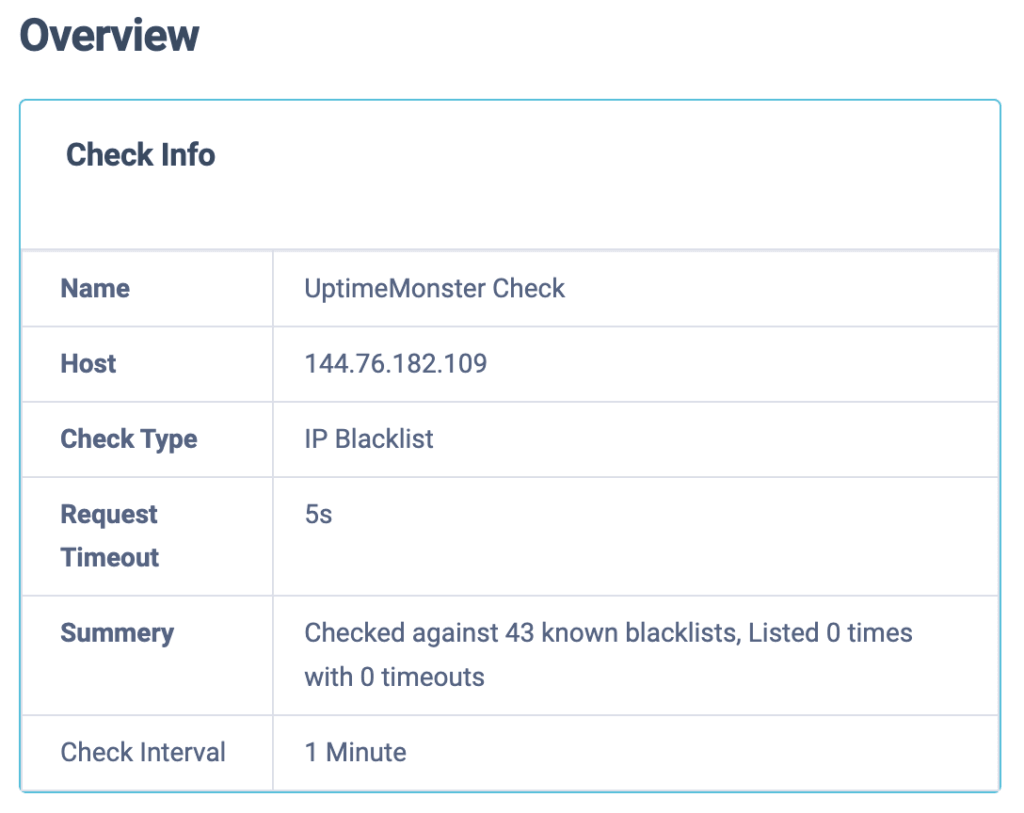
For IP blacklist check you can see all the blacklist websites for your IP too. Our tools will check against 43 known blacklists, and if your IP is blacklisted in any of them it will alert you instantly.