Server Overview
After adding the server click on the All Servers option to see all of your added servers. You can see a list of your adding servers and its overview. From the server list, you can see the usages of the CPU, RAM, and Disk. You can also see the load average and net inbound and outbound too. Then you can see the uptime percentage of your server.

Using the three dots icon on the right side you can view, edit and delete any server. There is also a filter option available that enables you to search your server with different criteria.

Click on the view details to see the overview of your server. Here you can see the percentage of the key system metrics like –
- Used Swap
- Used RAM
- CPU Usage
- Net inbound
- Net outbound

Now you can view the graph of the following component –
- Load Averages – This refers to the number of processes that are either currently being executed by the CPU or are waiting for execution in the queue. Monitor how the system resource is engaged for this server.
- CPU Usages – An aggregation(in %) of your system CPU usage by other applications.
- Ram Usages – System Random Access Memory (i.e. physical memory) usage.
- Network Speed – Eth0 is a physical interface representing an Ethernet network card while lo/Local is a special virtual network interface called a loopback device.
- Disk Usages – Disk usage(in %) of your server.
- Inode Usage – An inode is a data structure that keeps track of all the files and directories within a UNIX-based filesystem.
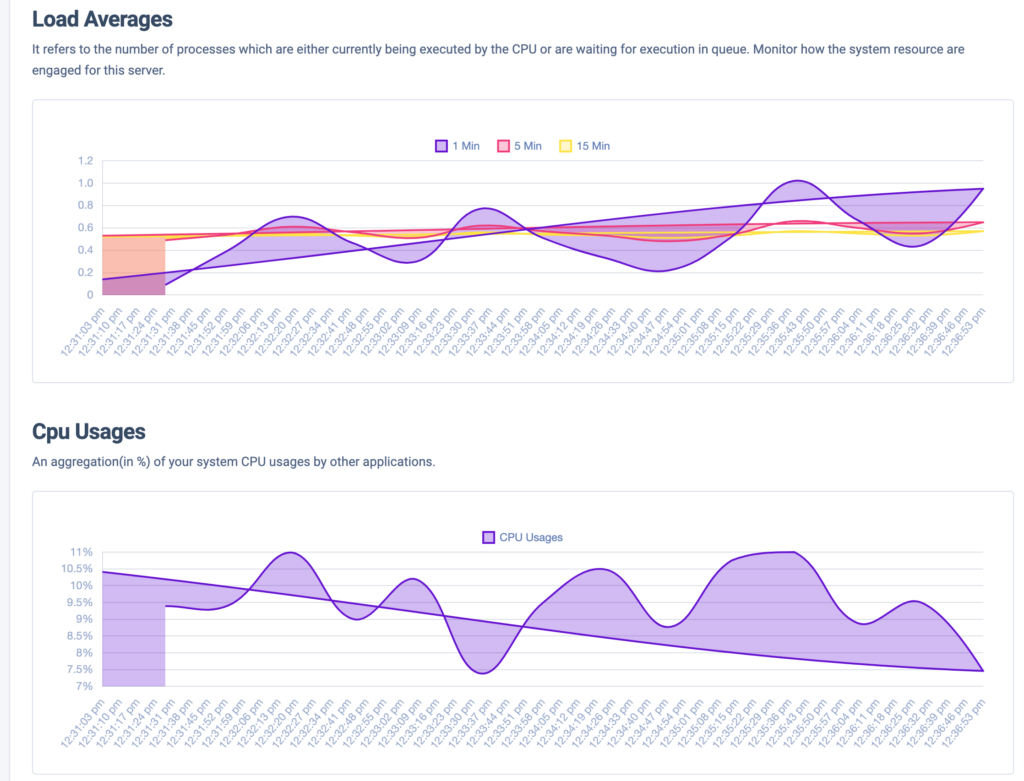
The graph will show you a visual representation of your website data. The graph data will synch with your selected time too.
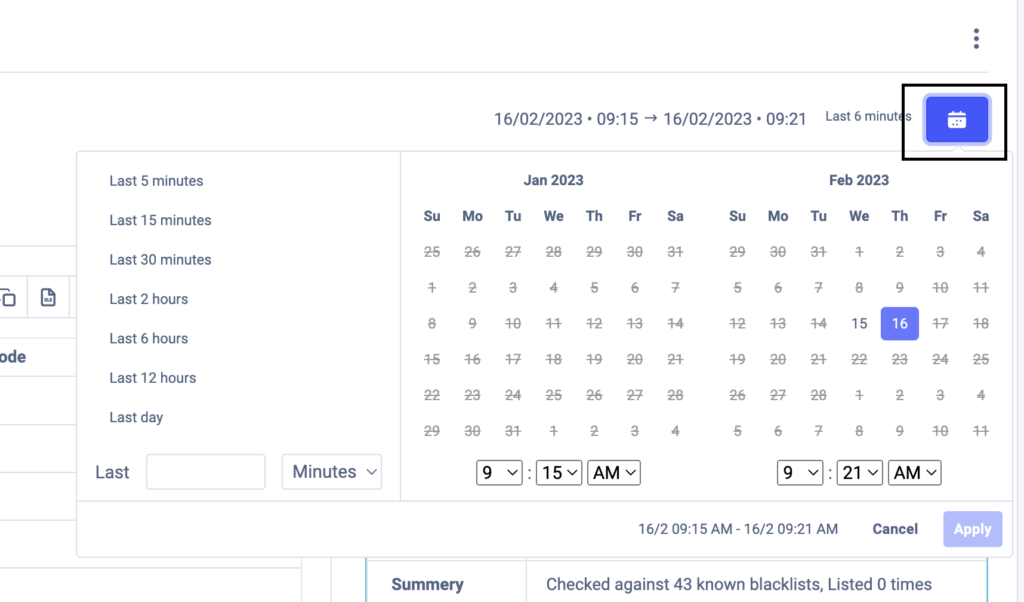
You can also filter the graph data to see specific time period data. For example, if you need the last 30 minutes’ data or the data from the previous day, or any specific time period, you can easily get it. Our advanced filer features will provide you with the specific time data you need.
To filter the data click on the calendar icon on the right sidebar and then set the specific date and time to get the data you want to display.
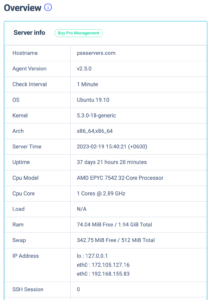
From the right sidebar, you will be able to see the following server information for the monitor –
- Hostname
- Agent Version
- Check Interval
- OS
- Kernel
- Arch
- Server Time
- Uptime
- Cpu Model
- Ram & many more