Check website overview
After adding the website click on the All Sites option to see all of your websites. You can see a list of your adding website and its overview. You can check all your website’s uptime, and HTTP status, and assign groups and alerts. You can get an overview of all your websites so that you can take the necessary actions.

Using the three dots icon on the right side you can view, edit and delete any website. There is also a filter option available that enables you to search your website with different criteria.

Click on the view details to see the overview of your website. You can see your website uptime report, performance graph, and performance log.
First, you can see an overview of your website like –
- Latest Downtime
- Availability
- Responsiveness
- Response Time

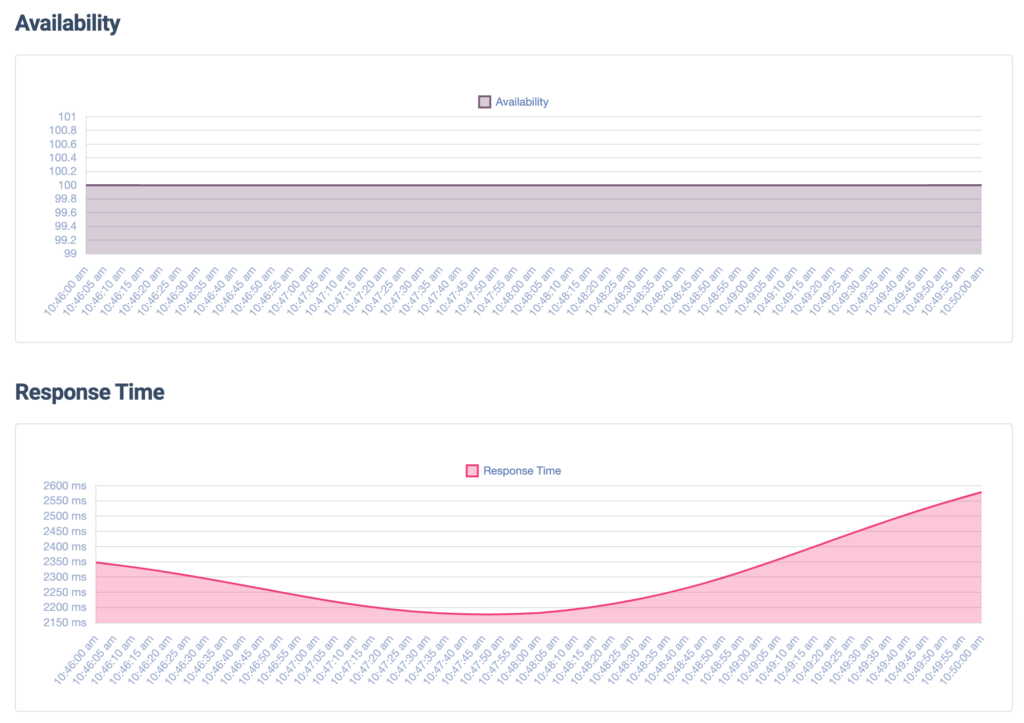
You can view the graph of Availability, Response Time and Responsiveness The graph will show you a visual representation of your website data. The graph data will synch with your selected time too.
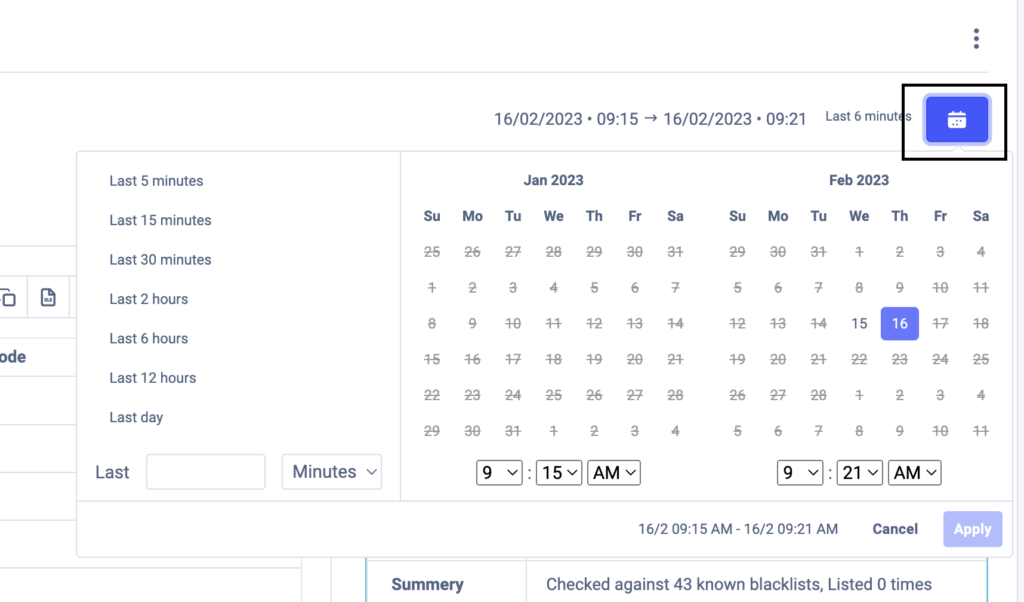
You can also filter the graph data to see specific time period data. For example, if you need the last 30 minutes’ data or the data from the previous day, or any specific time period, you can easily get it. Our advanced filer features will provide you with the specific time data you need.
To filter the data click on the calendar icon on the right sidebar and then set the specific date and time to get the data you want to display.
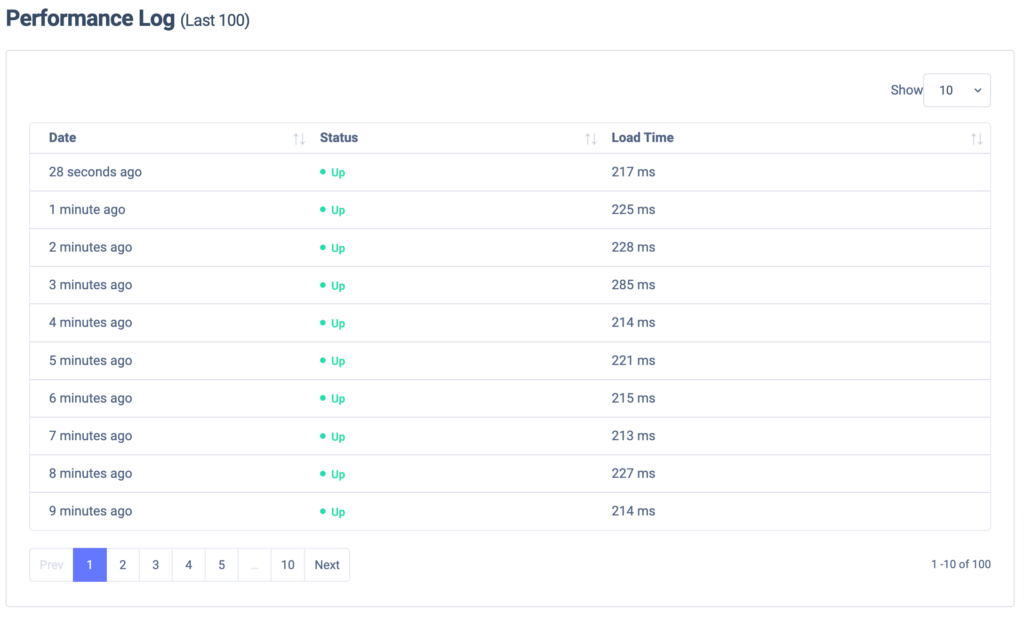
Scroll down to see the Performance table where you can see the last 100 performance log of your website. The performance table provides your website status and load time.
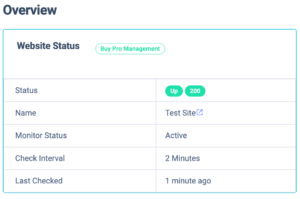
Here in the right sidebar, you can see your website information overview like –
- WebsuteStatus
- Website Name
- Monitor Status
- Interval Time
- Last Checked Time and others
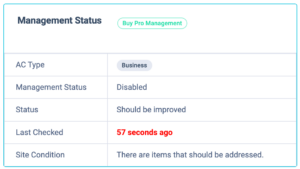
If you enable the Website Management Addons then a management overview table will be showing up like this
- AC Type
- Management Status
- Last Checked Time
- Site Condition & others
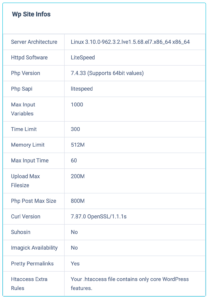
After that from the Wp Site Infos table, you will be able to see overview information of your website like –
- Server Architecture
- Httpd Software LiteSpeed
- Php Version
- Time Limit
- Memory Limit
- Upload Max Filesize & Others